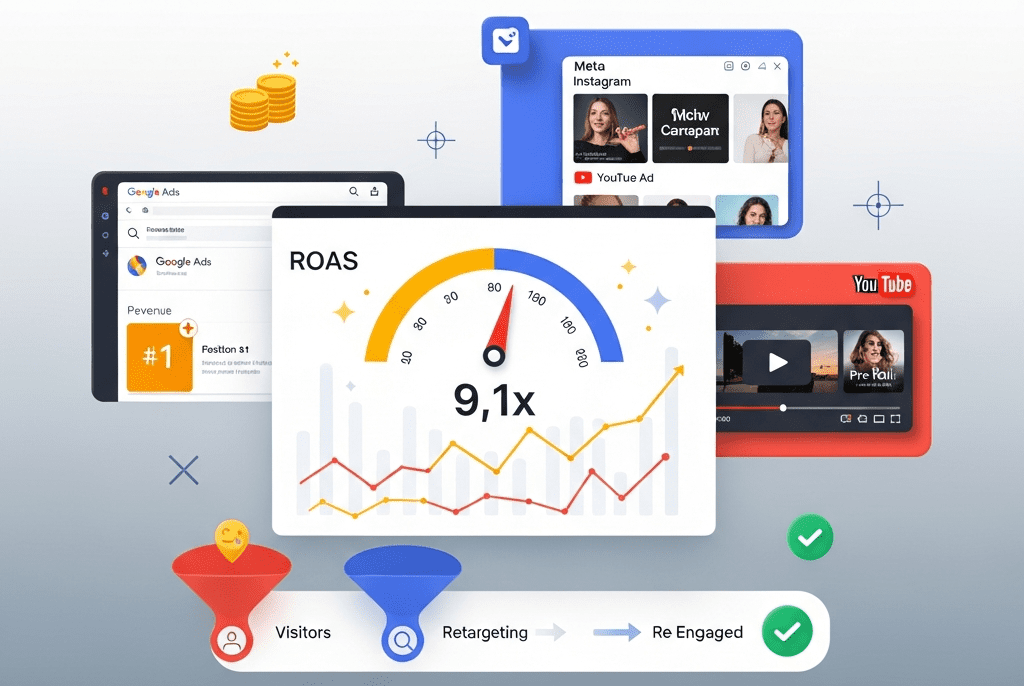
We built and managed a multi-platform paid advertising system for UrbanStay Serviced Apartments — reducing cost per booking by 62%, increasing ROAS from 2.4× to 9.1×, and scaling monthly ad-driven revenue from $38,000 to $142,000 across Google, Meta, and YouTube.
Google Ads, Meta Ads Manager (Facebook + Instagram), YouTube Ads, Google Analytics 4, Google Tag Manager, Google Looker Studio, SEMrush, SpyFu, Unbounce, Hotjar, ChatGPT API (OpenAI), Canva, CapCut Pro, Zapier, HubSpot CRM, Google Sheets, Airtable, Slack, WordPress
Project Year
2025
The Overview
UrbanStay operates 120 premium serviced apartments across Bangalore, Hyderabad, and Pune — targeting business travelers, relocating professionals, and medical tourists seeking furnished, hotel-alternative stays of 3-30+ nights. Average booking value: $680. Monthly marketing budget: $18,000 across Google Ads and Facebook Ads.
Despite spending $18,000/month, UrbanStay was barely breaking even on paid advertising. Their Google Ads account was a graveyard of bloated campaigns with 2,400+ keywords (most irrelevant), broad match types bleeding budget on unqualified searches, and zero negative keyword management. Their Facebook Ads consisted of boosted posts with no audience strategy, no funnel alignment, and no conversion tracking. YouTube — their highest-potential platform for showcasing beautiful apartments — was completely untouched.
The result: Cost per booking of $186 on a $680 average booking value. After operational costs and commissions, each ad-acquired booking generated almost zero profit. The marketing team was spending $18,000/month to essentially run in place.
We rebuilt the entire paid advertising operation from the ground up — auditing and restructuring every campaign, fixing conversion tracking, building proper audience targeting, creating platform-specific creative strategies, launching YouTube ads, implementing a retargeting funnel, and establishing data-driven optimization processes that turned paid ads from a cost center into UrbanStay’s most profitable growth engine.
The Challenge
Google Ads Chaos:
2,400+ keywords across 14 campaigns with no logical structure
68% of keywords on broad match — triggering for irrelevant searches like “cheap hotel rooms,” “free stay,” “apartment for sale”
Zero negative keywords in 18 months of running
Search term report revealed 42% of clicks came from completely irrelevant queries
No ad extensions configured (sitelinks, callouts, structured snippets, location, call)
Single landing page (homepage) for all ads regardless of keyword intent
No conversion tracking — optimizing for clicks, not bookings
Monthly Google Ads spend: $12,000 | Trackable bookings: ~38 | Cost per booking: $316
Meta Ads Negligence:
All “campaigns” were boosted posts — no Ads Manager campaigns with proper objectives
No Meta Pixel installed — zero conversion tracking
Audience targeting: “All India, Age 18-65” (essentially no targeting)
No retargeting audiences built
Creative: static property photos with no compelling copy or CTA
Monthly Meta spend: $6,000 | Trackable bookings: ~26 | Cost per booking: $231
Zero Retargeting: 94% of website visitors left without booking. With 8,400 monthly visitors, that’s ~7,900 interested prospects vanishing with zero follow-up. No retargeting pixels installed on any platform.
No YouTube Presence: Serviced apartments are highly visual products — YouTube is the ideal platform for virtual tours, testimonials, and lifestyle content. Yet UrbanStay had zero YouTube ad presence despite competitors running successful video campaigns.
Landing Page Disaster: Every ad — regardless of whether someone searched “serviced apartment Bangalore,” “corporate housing Hyderabad,” or “monthly stay Pune” — landed on the generic homepage. No city-specific landing pages, no intent-matched messaging, no booking-focused design.
Attribution Black Hole: No proper conversion tracking meant the team couldn’t distinguish between campaigns generating bookings and campaigns burning cash. Budget allocation was based on gut feeling, not data.
Competitive Disadvantage: Top 3 competitors had:
Structured Google Ads with dedicated landing pages per city
Professional Meta Ads with video creatives and lookalike audiences
YouTube pre-roll ads with virtual apartment tours
Retargeting across all platforms
Average CPA 40-60% lower than UrbanStay
Our Approach & Strategy
Phase 1: Tracking Foundation & Competitive Intelligence (Week 1)
Conversion Tracking Infrastructure:
Platform
Tracking Implemented
Conversion Events
Google Ads
Enhanced conversions via GTM
Booking completed (primary), booking form started, phone call click, WhatsApp click, date search initiated
Video views (25/50/75/100%), website visit from video, booking from video viewer
Google Analytics 4
Enhanced e-commerce configured
Full booking funnel: property view → date selection → form start → form complete → booking confirmed
HubSpot CRM
Zapier integration
Every booking lead auto-created with source attribution — connecting ad click to closed booking
Competitive Intelligence Audit (SEMrush + SpyFu):
Competitor
Monthly Ad Spend (Est.)
Top Keywords
Creative Strategy
Gap/Opportunity
Competitor A
$22,000
“serviced apartments bangalore,” “corporate stay”
Video tours + testimonial ads
Strong on search, weak on retargeting
Competitor B
$15,000
“furnished apartments,” “monthly rentals”
Professional photography + carousel
No YouTube presence
Competitor C
$18,000
“business traveler accommodation”
Lifestyle video ads + UGC
Weak landing pages (homepage only)
Key Insight: No competitor had a fully integrated multi-platform strategy with dedicated landing pages + retargeting + YouTube. This was UrbanStay’s opportunity to leapfrog all three.
Campaign 7: [Retargeting] Website Visitors → Audience: Visited site, didn't book (7-30 day window) → Creative: Dynamic property ads based on pages viewed → Budget: $1,200/month
Campaign 8: [Retargeting] Booking Abandoners → Audience: Started booking form but didn't complete → Creative: "Still interested? Your apartment is waiting" → Budget: $800/month
PERFORMANCE MAX:
Campaign 9: [PMax] All Properties → Asset groups by city with images, videos, headlines → Audience signals: business travelers, relocation, medical travel → Budget: $2,000/month
TOTAL GOOGLE ADS BUDGET: $15,300/month (Reallocated from original $12,000 + $3,300 from Meta optimization savings) ━━━━━━━━━━━━━━━━━━━━━━━━━━━━━━━━━━━━━━━━━━
Ad Copy Strategy (Per Campaign):
Ad Element
Before
After
Headlines
“UrbanStay Apartments” (generic)
“Serviced Apartments in Bangalore — Book Direct & Save 15%” / “Fully Furnished, Wi-Fi, Housekeeping — From ₹3,500/Night”
Descriptions
“We offer apartments. Contact us.”
“120+ Premium Serviced Apartments Across 3 Cities. Ideal for Business Travelers & Relocations. Flexible 3-30+ Night Stays. Book Direct for Best Rates. Free Airport Pickup on Stays 7+ Nights.”
15 headlines + 4 descriptions per RSA — Google auto-optimizes combinations
Bid Strategy Shift:
Before
After
Why
Manual CPC (set and forget)
Target CPA (automated)
Let Google’s AI optimize for actual bookings, not clicks
Optimizing for clicks
Optimizing for conversions (bookings)
Only pay effectively for what matters
Same bid every keyword
Bid adjustments by device (+20% mobile), location, time of day, audience
Higher bids when conversion probability is highest
Quality Score Improvement Plan:
Factor
Before (Avg 3.8)
After (Avg 7.4)
How
Ad Relevance
Below average
Above average
Tight keyword-to-ad matching, specific ad copy per ad group
Landing Page Experience
Below average
Above average
City-specific landing pages matching ad intent
Expected CTR
Below average
Above average
Compelling ad copy, extensions, RSA optimization
Phase 3: Meta Ads Strategy & Build (Week 3)
Campaign Architecture (Full-Funnel):
META ADS FUNNEL ARCHITECTURE ━━━━━━━━━━━━━━━━━━━━━━━━━━━━
TOFU — AWARENESS (30% of budget — $1,800/month) ━━━━━━━━━━━━━━━━━━━━━━━━━━━━━━━━━━━━━━━━━━━━━ Campaign: Brand Awareness — Video Views → Objective: Video Views (ThruPlay) → Creative: 30-60 sec apartment tour videos (3 per city) → Audience: • Interest: Business travel, corporate housing, relocation • Lookalike: 1% of past bookers • Demographics: Age 25-55, income targeting → Goal: Build awareness pool for retargeting
Homepage visitors → Google Display: Brand awareness banner (didn't go deeper) Meta: Video tour of featured apartments YouTube: "Discover UrbanStay" pre-roll
Property page viewers → Google Display: Dynamic ad showing viewed property (browsed specific city) Meta: Carousel of apartments in that city YouTube: City-specific tour video
Date search initiated → Google Display: "Apartments available for your dates!" (checked availability) Meta: Urgency ad — "Limited availability for [dates]" Email: If captured — availability confirmation
Booking form started → Google Display: "Complete your booking — special offer inside" (abandoned form) Meta: "Your apartment is still available" with discount Email: If captured — abandoned booking recovery (3-email sequence) SMS: If captured — 24-hour booking reminder
Past guest → Google Display: "Welcome back" loyalty offer (stayed previously) Meta: "Book your next stay — loyal guest discount" Email: Replenishment email based on past stay patterns YouTube: "What's new at UrbanStay" update video
CROSS-PLATFORM FREQUENCY CAP: Max 4 retargeting impressions/day/person (prevents ad fatigue and annoyance) ━━━━━━━━━━━━━━━━━━━━━━━━━━━━━━━━━━━━━━━━━━━━━
Cross-Platform Budget Orchestration:
Platform
Monthly Budget
% of Total
Primary Role
Google Search
$11,300
44%
Capture high-intent searches (bottom funnel)
Google Display/Remarketing
$2,000
8%
Retarget website visitors
Google PMax
$2,000
8%
AI-optimized cross-network reach
Meta Ads (TOFU)
$1,800
7%
Awareness — video tours, lookalike audiences
Meta Ads (MOFU)
$1,800
7%
Consideration — testimonials, carousels
Meta Ads (BOFU)
$2,400
9%
Conversion — retargeting, offers
YouTube Ads
$4,000
15%
Brand building + retargeting (high-impact visual)
Testing Budget
$700
2%
Reserved for new creative/audience tests
Total
$26,000/month
100%
Budget increased from $18,000 to $26,000 — justified by improved efficiency making each dollar work 3-4× harder. At the new ROAS of 9.1×, the additional $8,000 generates approximately $72,800 in additional revenue.
Views, VTR (view-through rate), cost per view, website visits from video, bookings attributed
Landing Pages
Conversion rate per landing page, bounce rate, form completion rate, time on page
Retargeting
Audience size, frequency, conversion rate, ROAS — by segment (viewers vs. abandoners vs. past guests)
Testing
Active tests, completed tests, winning variants, cumulative performance lift
Competitor Monitor
Competitor ad visibility, estimated spend, new creative detected
Budget Pacing
Daily/weekly spend vs. budget, projected month-end spend, over/under alerts
Automated Alerts:
Alert
Trigger
Action
CPA spike
Any campaign CPA exceeds target by 30%+ for 2 days
Slack alert → investigate + pause if needed
Budget pacing
Campaign on track to overspend by 15%+
Slack alert → adjust daily budget
Quality Score drop
Any keyword QS drops below 5
Slack alert → audit ad relevance + landing page
Creative fatigue
Any ad CTR drops 25%+ from peak
Slack alert → refresh creative
Conversion tracking error
Zero conversions recorded for 24 hours (unusual)
Slack urgent alert → check GTM/pixel
Competitor new campaign
SpyFu detects competitor launching new keyword set
Slack weekly digest → evaluate response
High performer detected
Any campaign exceeds ROAS 12×+ for 3 days
Slack celebration 🎉 → increase budget 20%
Monthly AI Strategy Report:
URBANSTAY PPC INTELLIGENCE — MARCH 2025
━━━━━━━━━━━━━━━━━━━━━━━━━━━━━━━━━━━━━━━

📊 OVERALL: Excellent (ROAS: 9.1× | Target: 7×)

💰 REVENUE & SPEND:
  Total ad spend: $26,000
  Total ad-attributed revenue: $142,480
  Blended ROAS: 9.1× (↑ from 8.4× Feb)
  Total bookings from ads: 204 (↑ from 186 Feb)
  Cost per booking: $127 (↓ from $142 Feb)

🏆 TOP PERFORMERS:
  1. Google Search [Bangalore]: ROAS 12.4× — 68 bookings
  2. Meta Retargeting [Booking Abandoners]: ROAS 18.6× — 24 bookings
  3. YouTube In-Stream [Apartment Tours]: ROAS 6.8× — building pipeline

📉 UNDERPERFORMERS:
  • Google Search [Generic/Non-Branded]: ROAS 3.2× — refine keywords
  • Meta TOFU [Interest Targeting]: High reach, low conversion —
    test new interest combinations

🧪 TEST RESULTS:
  • "Free Airport Pickup" offer beat "15% discount" by 34% conversion rate
  • Testimonial video ads outperformed tour videos by 28% CTR on Meta
  • Bangalore landing page with pricing visible: +22% conversion vs. hidden

🎯 NEXT MONTH ACTIONS:
  1. Increase Bangalore search budget 20% (highest ROAS city)
  2. Roll out "Free Airport Pickup" offer across all campaigns
  3. Shift Meta TOFU budget toward testimonial-style creatives
  4. Launch dedicated "Medical Stay" campaign for Bangalore hospitals
  5. Test YouTube Discovery ads targeting relocation-related searches
  6. Create dynamic remarketing for Pune (currently only static ads)

💡 BUDGET RECOMMENDATION:
  Increase total budget to $30,000 (+$4,000)
  Additional $4K allocated to Bangalore Search (+$2K) and
  YouTube retargeting (+$2K) — projected incremental
  revenue: $36,000+ at current ROAS levels
━━━━━━━━━━━━━━━━━━━━━━━━━━━━━━━━━━━━━━━━━━
Key Features Delivered
Feature
Description
Full Google Ads Rebuild
2,400 chaotic keywords restructured into 9 strategic campaigns with city-specific targeting, competitor campaigns, and Performance Max — Quality Score improved from 3.8 to 7.4
Segmented retargeting across Google, Meta, and YouTube — different messaging for homepage visitors, property viewers, date searchers, booking abandoners, and past guests
840+ Negative Keywords
Comprehensive negative keyword list eliminating $2,800/month in previously wasted spend on irrelevant searches
Conversion Tracking Infrastructure
End-to-end tracking from ad click to confirmed booking with revenue attribution across all platforms via GTM, Pixel, CAPI, and CRM integration
Structured Testing Program
Systematic A/B testing across ad copy, landing pages, audiences, creatives, bid strategies, and offers with weekly optimization rhythm
Cross-Platform Budget Orchestration
Data-driven budget allocation across Google, Meta, and YouTube with weekly rebalancing toward highest-performing channels
PPC Performance Dashboard
Real-time Looker Studio dashboard tracking revenue, cost efficiency, platform performance, landing pages, retargeting, and competitor monitoring
Automated Alert System
Instant notifications for CPA spikes, budget pacing, QS drops, creative fatigue, tracking errors, and high-performance detection
Monthly AI Strategy Report
ChatGPT-generated analysis with performance summary, winners, underperformers, test results, and budget recommendations
Challenge: UrbanStay spent $18,000/month on paid ads with a dismal 2.4× ROAS — 2,400 chaotic Google Ads keywords with 42% irrelevant clicks, boosted Facebook posts with zero conversion tracking, no YouTube presence, no retargeting, all ads landing on the generic homepage, and a $186 cost per booking on $680 average booking value.
Solution: We rebuilt the entire paid advertising operation — restructured Google Ads into 9 precision campaigns, built a full-funnel Meta Ads strategy with proper Pixel/CAPI tracking, launched YouTube ads with 12 video creatives, created 8 intent-matched landing pages, deployed multi-platform retargeting across 5 visitor segments, implemented 840+ negative keywords, and established a data-driven weekly optimization rhythm with AI-powered monthly strategy reports.
Result: ROAS improved from 2.4× to 9.1×. Cost per booking dropped 62% ($186 to $71). Monthly ad-attributed revenue grew from $38,000 to $142,000. Bookings from ads tripled. Landing page conversion increased 367%. $2,800/month in wasted spend eliminated. YouTube ads generate 28 bookings/month. Retargeting converts at 4.8%. Annual ad-attributed revenue trajectory: $1.7M.
Burning Money on Ads That Don’t Convert? Let’s Fix That.
We audit, rebuild, and manage paid advertising campaigns across Google, Meta, and YouTube — eliminating wasted spend, fixing conversion tracking, building retargeting funnels, and optimizing relentlessly until every ad dollar works harder than the last.