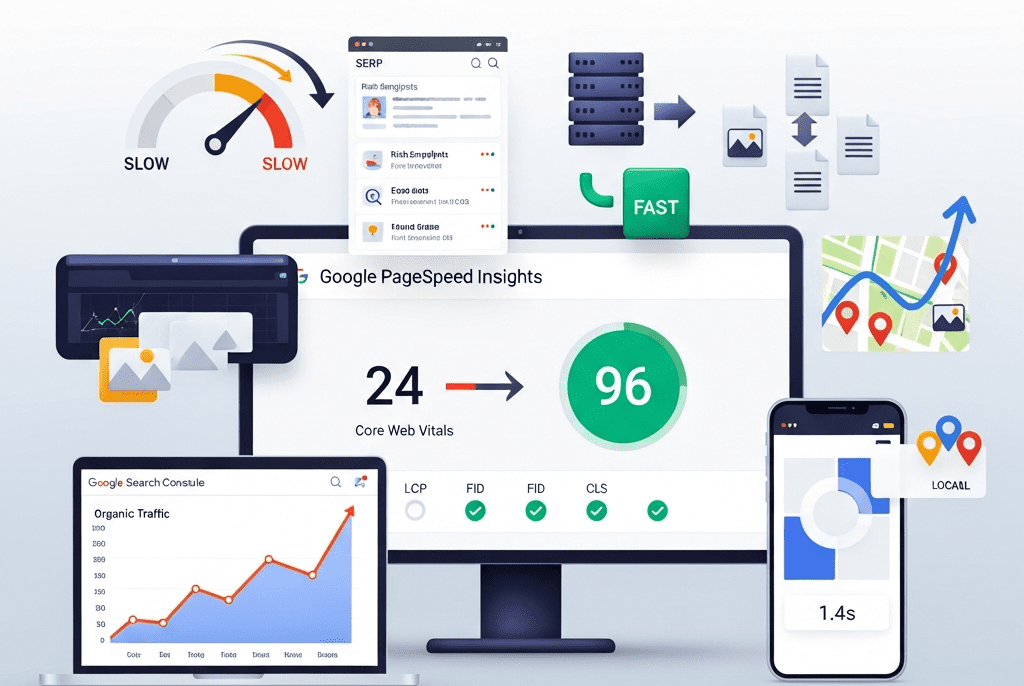
We performed a complete speed and SEO optimization for Northwell Partners — taking page load time from 7.2s to 1.4s, lifting Google PageSpeed from 24 to 96 (mobile), growing organic traffic 284%, achieving 42 first-page keyword rankings from zero, and transforming a slow, invisible WordPress site into a fast, high-ranking client acquisition machine.
Comprehensive Speed Audit & Optimization, Core Web Vitals Remediation, Server & Hosting Optimization, Image & Asset Optimization Pipeline, Database & Code Cleanup, Technical SEO Audit & Implementation, On-Page SEO Optimization, Schema Markup Implementation, Internal Linking Architecture, Content SEO Strategy, Local SEO (Multi-Office), SEO Monitoring & Reporting System
Tools & Platforms Used
Google PageSpeed Insights, GTmetrix, WebPageTest, Chrome DevTools (Lighthouse), Google Search Console, Google Analytics 4, Screaming Frog SEO Spider, Semrush, Ahrefs, Yoast SEO Premium, WP Rocket, ShortPixel, Cloudflare Pro, Perfmatters, Query Monitor, Asset CleanUp Pro, JEBI (Schema), WP-Optimize, Redis Object Cache, Imagify, Google Tag Manager, Google Business Profile, Notion, Slack, Loom
Project Year
2025
The Overview
Northwell Partners is a global financial advisory firm with 62 advisors across offices in Boston, London, and Toronto. They provide wealth management, retirement planning, corporate advisory, and estate planning services to high-net-worth individuals and mid-market enterprises. Assets under management: $4.2B. Annual revenue: $38M. Their client base includes C-suite executives, business owners, and multi-generational family offices.
Their WordPress website — redesigned 18 months ago by a premium agency for $85,000 — looked beautiful. Full-screen hero videos, parallax scrolling, animated counters, custom icon sets, interactive service diagrams, and a sophisticated advisor directory. The design won an Awwwards Honorable Mention.
There was just one problem: it was practically unusable.
The homepage took 7.2 seconds to load. On mobile (54% of traffic), it was worse — 9.8 seconds. Google PageSpeed scored it 24/100 (mobile) and 41/100 (desktop). All three Core Web Vitals were “Poor.” The hero video alone was 18MB. The page loaded 4.2MB of JavaScript — more than most entire websites. Every page had 142 HTTP requests. The beautiful animated counters used a JavaScript library that was 380KB. For counting to 4.
And the SEO? The $85,000 agency had apparently never heard of it. No meta descriptions on 67 of 84 pages. No schema markup. No XML sitemap optimization. A robots.txt file that accidentally blocked Google from crawling the advisor directory (their most important section). H1 tags used for styling rather than content hierarchy — the homepage had 7 H1 tags. Internal linking was random. Image alt text was either missing or auto-generated (“IMG_4872.jpg”). The site ranked for exactly 12 keywords — all branded (the firm’s name).
For a financial advisory firm where trust and credibility are everything, a slow website signals the opposite: “We don’t have our act together.” And for a firm spending $180K/year on Google Ads driving traffic to pages that took 7+ seconds to load, speed wasn’t just a user experience issue — it was burning money. Google’s own data shows 53% of mobile visitors leave if a page takes more than 3 seconds to load. Northwell was losing more than half their visitors before the page even appeared.
We performed a complete speed and SEO optimization — from server-level performance overhaul and asset optimization to technical SEO remediation, on-page optimization, schema markup, internal linking architecture, and local SEO for three offices — transforming their slow, invisible website into a fast, high-ranking client acquisition machine.
The Challenge
Speed Performance (Before):
Metric
Homepage
Advisor Directory
Service Pages
Target
Page Load Time
7.2 seconds
6.8 seconds
5.4 seconds
< 2.0 seconds
Google PageSpeed (Mobile)
24/100
28/100
32/100
90+
Google PageSpeed (Desktop)
41/100
44/100
48/100
95+
Largest Contentful Paint (LCP)
6.4 seconds (Poor)
5.8 seconds (Poor)
4.2 seconds (Poor)
< 2.5 seconds
First Input Delay (FID/INP)
380ms (Poor)
320ms (Poor)
280ms (Poor)
< 200ms
Cumulative Layout Shift (CLS)
0.42 (Poor)
0.28 (Poor)
0.18 (Poor)
< 0.1
Total Page Size
12.4 MB
8.6 MB
6.2 MB
< 2.0 MB
HTTP Requests
142
118
96
< 40
JavaScript Size
4.2 MB
3.8 MB
2.9 MB
< 500 KB
Time to First Byte (TTFB)
1.8 seconds
1.6 seconds
1.4 seconds
< 0.4 seconds
Root Causes Identified:
Problem
Size/Impact
Cause
Hero video (unoptimized)
18MB MP4, auto-playing on all devices including mobile
Agency used raw camera footage, no compression, no mobile fallback
JavaScript bloat
4.2MB across 28 JS files, 18 render-blocking
Animation libraries (GSAP, ScrollMagic, Anime.js, CountUp.js, Particles.js) — most used for one small element each
CSS bloat
1.8MB across 12 CSS files
Elementor’s generated CSS + theme CSS + 6 plugin CSS files, 82% unused on any given page
Unoptimized images
68 images averaging 1.2MB each (should be ~100KB)
Full-resolution photos uploaded without compression, no WebP, no responsive srcset
No caching
Every visit regenerated the page from scratch
No page caching, no browser caching, no CDN configured
Shared hosting
TTFB: 1.8 seconds
Budget shared hosting ($12/month) for an $85,000 website — server shared with 200+ other sites
Google Fonts (external)
4 font families, 12 weights, loaded from Google API
Render-blocking external requests, loading fonts never used on the page
No lazy loading
All 68 images + 3 videos loaded immediately on page load
Below-fold content loading before visitor scrolls to it
Unused plugins loading assets globally
8 plugins loading CSS/JS on every page even when not used on that page
Contact Form 7 loading on pages with no forms, Slider Revolution loading on pages with no sliders
SEO Performance (Before):
Metric
Current
Where It Should Be
Gap
Keywords Ranking (Page 1)
12 (all branded)
50-80+ (branded + service + location)
No non-branded visibility
Monthly Organic Traffic
2,800 visitors
10,000-15,000 (for a firm this size with this content)
72-81% below potential
Organic Traffic as % of Total
18%
40-55%
Over-reliant on paid traffic
Monthly Google Ads Spend
$15,000
Could reduce significantly with organic ranking
Paying for traffic that should be free
Pages with Meta Descriptions
17 of 84 (20%)
100%
67 pages with auto-generated or missing snippets
Pages with Optimized H1
8 of 84 (10%)
100%
7 H1 tags on homepage alone
Schema Markup
None
Organization, LocalBusiness, Person, FAQPage, BreadcrumbList, Service
Zero structured data for search engines
Internal Links (Avg per Page)
2.4
8-12
Weak internal linking = poor page authority distribution
Image Alt Text Coverage
24%
100%
76% of images invisible to search + accessibility failure
font-display: swap — text visible immediately in fallback font, swaps to custom font when loaded
No invisible text, no layout shift from font loading
Subset
Full Unicode range for all fonts
Latin subset only (covers EN/FR/DE)
40-60% smaller font files
JavaScript & CSS Cleanup:
Action
Tool
Impact
Per-page asset loading
Perfmatters + Asset CleanUp Pro: disable plugins’ CSS/JS on pages where they’re not used
Contact Form 7 CSS/JS removed from 78 pages that have no forms. Slider Revolution removed from 80 pages with no slider. WooCommerce assets removed from non-shop pages.
Animation library consolidation
Replaced 5 separate animation libraries (380KB+ combined) with CSS animations + minimal vanilla JS (12KB total)
The counter that counted to 4 no longer needs a 380KB library
Third-party script delay
WP Rocket delay JS: Google Analytics, Facebook Pixel, Google Tag Manager, Hotjar, Intercom chat — all delayed until user interaction (scroll, click, touch)
These scripts load AFTER the page is interactive — zero impact on initial load
jQuery migration removal
Removed jQuery Migrate (deprecated, only needed for legacy plugins)
30KB less JS
Inline critical CSS
WP Rocket auto-generates critical CSS per page template
HOMEPAGE ├── Links to all 6 service pages (primary nav + content links) ├── Links to 4 pillar content guides ├── Links to featured advisors (rotating) └── Links to latest blog posts
SERVICE PAGES (6) ├── Links to related advisors (who specialize in this service) ├── Links to relevant blog posts / case studies ├── Links to FAQ section (same page) ├── Links to contact/consultation page └── Cross-links to related service pages
ADVISOR PROFILES (62) ├── Links to their practice areas (service pages) ├── Links to articles they've authored (blog) ├── Links to office location page └── Links to consultation booking
PILLAR CONTENT (4 Guides) ├── Links to relevant service pages (commercial intent) ├── Links to advisors who specialize in topic ├── Links to related blog posts (supporting content) └── Links to contact/consultation
BLOG POSTS (34 existing + ongoing) ├── Links to parent pillar content ├── Links to relevant service pages ├── Links to advisors mentioned └── Cross-links to related posts
RESULT: Every page links to 8-12 other relevant pages. Topic clusters form around service areas with pillar content at the center. Authority flows throughout the site. ━━━━━━━━━━━━━━━━━━━━━━━━━━━━━━━━━━━━━━━━━━━━━━━━━━━━━━━
Phase 5: Local SEO, Monitoring & Reporting (Week 5)
Local SEO (3 Offices):
Element
Implementation (Per Office)
Google Business Profile
Claimed, verified, and fully optimized: business name, category (Financial Planner), address, phone, hours, website (linked to office-specific landing page), description (250 words, keyword-rich), services listed, photos (exterior, interior, team — 15+ per office), Q&A pre-populated with common questions
Office Landing Pages
Dedicated page per office: /locations/boston/, /locations/london/, /locations/toronto/ — with unique content (not duplicated), local team profiles, driving directions, embedded Google Map, local testimonials, and LocalBusiness schema
NAP Consistency
Name, Address, Phone verified as identical across: website, Google Business Profile, LinkedIn, Yelp, industry directories, and legal registries
Local Citations
30+ quality citations per office: financial industry directories, local business directories, chamber of commerce listings
Review Strategy
Template request emails for Google reviews post-client engagement, review response protocol (respond to all within 48 hours)
Local Content
Blog posts with local relevance: “Wealth Management in Boston: What High-Net-Worth Individuals Should Know,” “London Financial Advisory Landscape 2025,” “Toronto Estate Planning Guide”
SEO Monitoring System:
What We Monitor
Tool
Frequency
Alert Trigger
Keyword Rankings
Semrush (42 target keywords tracked)
Weekly
Any keyword drops 5+ positions
Organic Traffic
Google Analytics 4
Weekly
Traffic drops 15%+ week-over-week
Core Web Vitals
Google Search Console + PageSpeed (automated)
Weekly
Any metric moves from “Good” to “Needs Improvement”
Crawl Errors
Google Search Console
Weekly
Any new crawl errors appear
Indexation
Google Search Console (“Pages” report)
Bi-weekly
Pages dropping from index or “Excluded” with unexpected reason
Backlink Profile
Ahrefs
Monthly
Toxic links detected, significant link gains/losses
Total organic sessions, trend vs. previous month and year-over-year, top landing pages from organic, new vs. returning
Keyword Rankings
Current position for all 42 tracked keywords, changes from last month, new keywords ranking, keywords approaching Page 1
Core Web Vitals
LCP, INP, CLS — all green? Any degradation? Speed benchmarks for key pages
Content Performance
Top 10 organic landing pages by traffic, top blog posts, pages needing content refresh
Local SEO
GBP insights: views, clicks, calls, directions per office. Local keyword rankings. Review count and rating.
Technical Health
Crawl errors, indexation status, any new issues detected
Recommendations
Next month priorities: new content to create, pages to optimize, technical improvements, opportunities identified
Handover Documentation:
Document
Purpose
Speed Optimization Record
Complete documentation of every optimization performed: before/after metrics, settings, configurations, tools
SEO Strategy Document
Keyword strategy, content plan, internal linking architecture, local SEO plan — living document updated quarterly
Schema Markup Reference
All schema implemented with code snippets, where applied, and how to add schema to new pages
Content SEO Checklist
For every new page/post: SEO title format, meta description template, H1 rules, alt text guidelines, internal linking minimum, schema requirements
Speed Maintenance Guide
How to maintain speed: image upload procedures, plugin installation rules, what not to do (no unoptimized videos, no new JS libraries without approval)
Monthly Report Template
Pre-formatted report structure with data sources and interpretation guide
Tool Access & Configuration
All tool logins, API keys, Search Console/Analytics access, monitoring configurations
Key Features Delivered
Feature
Description
Server Migration
Shared hosting ($12/mo) → Managed WordPress hosting with NVMe SSD, PHP 8.2, LiteSpeed — reducing TTFB from 1.8s to 0.28s
CDN & Edge Optimization
Cloudflare Pro: global CDN, edge image optimization, Brotli compression, HTTP/3, Early Hints, bot management
WordPress Caching System
WP Rocket: page caching, browser caching, critical CSS, JS defer/delay, database cleanup, DNS prefetch — fully configured and tested
Image Optimization Pipeline
842 images compressed (91% reduction), WebP conversion, responsive srcset, lazy loading — plus automated pipeline for future uploads
Video Optimization
36MB → 4.8MB total video payload, mobile poster images, lazy loading, Cloudflare Stream hosting
$8,500/month (reduced as organic captures paid keywords)
⬇ 43%
Estimated Monthly Value of Organic Traffic
~$4,200
$18,600 (based on equivalent CPC)
⬆ 343%
Advisor Profile Page Views
840/month
4,200/month (no longer blocked from Google)
⬆ 400%
Local Pack Appearances (3 Offices)
0
3 offices appearing in local pack for key service + location queries
—
Google Business Profile Views (Monthly, All 3)
1,200 (unoptimized)
8,400
⬆ 600%
GBP-Driven Calls (Monthly)
18
62
⬆ 244%
Blog Post Traffic (Monthly)
680 (thin content, no SEO)
3,400 (optimized + pillar content)
⬆ 400%
Consultation Requests (Organic Traffic)
8/month
34/month
⬆ 325%
New Client Revenue Attributed to Organic
~$120K/year (estimated)
$680K/year (estimated from organic-driven consultations)
⬆ 467%
Rich Results (Schema-Driven)
0
FAQ snippets on 4 pages + breadcrumbs on all pages + Knowledge Panel enhanced
—
📋 Case Study Summary
Challenge: Northwell Partners — a global financial advisory firm with $4.2B AUM and 62 advisors across Boston, London, and Toronto — had a beautifully designed but catastrophically slow WordPress website (7.2s load time, 24/100 PageSpeed mobile) and zero SEO visibility (12 branded keywords only, 67/84 pages missing meta descriptions, robots.txt blocking the advisor directory from Google). The $85,000 design agency delivered visual awards but no performance or SEO foundation. An 18MB hero video, 4.2MB of JavaScript, 142 HTTP requests per page, no caching, shared hosting, and no schema markup. The firm was spending $15,000/month on Google Ads driving traffic to pages where 53%+ of visitors left before the page loaded. For a wealth management firm where trust is everything, a slow website was an expensive credibility problem.
Solution: We performed a complete speed and SEO optimization — migrating to managed hosting (TTFB: 1.8s → 0.28s); deploying Cloudflare Pro CDN with edge optimization; configuring WP Rocket caching with critical CSS and deferred JS; compressing 842 images (91% reduction) with WebP and lazy loading; optimizing videos (36MB → 4.8MB); self-hosting fonts; cleaning JavaScript (4.2MB → 480KB) and CSS (1.8MB → 320KB) through per-page asset loading; fixing robots.txt, 48 crawl errors, redirect chains, and canonical tags; implementing 8 schema types across 84 pages including Person schema for 62 advisors; writing custom SEO titles and meta descriptions for all pages; adding alt text to 842 images; building internal linking architecture (2.4 → 10+ links per page); expanding 6 service pages and creating 4 pillar content guides; optimizing Google Business Profiles for 3 offices with 30+ citations each; and building a 9-point SEO monitoring system.
Result: Page load dropped from 7.2s to 1.4s. PageSpeed went from 24 to 96 (mobile). All Core Web Vitals reached “Good.” Page size shrank from 12.4MB to 1.1MB. Organic traffic grew 284% (2,800 → 10,750/month). Page 1 keywords grew from 12 to 54. Google Ads spend decreased 43% as organic captured paid keywords. Bounce rate dropped 50%. Session duration grew 226%. Advisor profile views grew 400% (directory no longer blocked from Google). Local pack appearances achieved for all 3 offices. GBP-driven calls grew 244%. Organic consultation requests grew 325%. Estimated organic-attributed new client revenue grew from $120K to $680K annually. Speed and SEO aren’t separate — together, they’re the foundation everything else stands on.
A Beautiful Website Nobody Can Find Is Just Expensive Art
We optimize WordPress speed and SEO so your website loads in under 2 seconds, ranks on Page 1 for the keywords that matter, and converts the traffic you’re already paying for — turning your website from a digital brochure into a client acquisition engine.