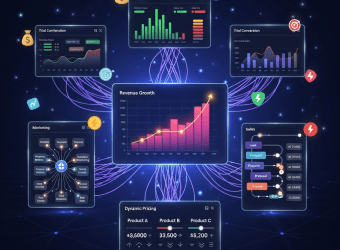
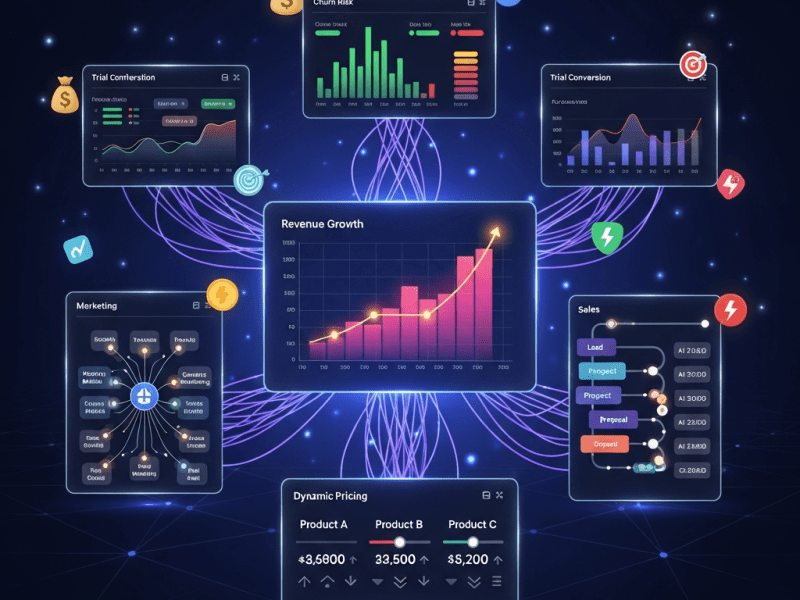
We engineered a comprehensive AI sales and marketing intelligence system for NovaBridge SaaS — unifying predictive analytics, AI-driven campaigns, dynamic pricing, and intelligent sales coaching to increase revenue 127% and cut customer acquisition cost by 54%.
AI Sales Intelligence Strategy, Predictive Sales Analytics, AI Marketing Automation, Dynamic Pricing Intelligence, Conversion Optimization AI, Sales Coaching AI System, Revenue Attribution Modeling, AI-Powered Retargeting
Tools & Platforms Used
ChatGPT API (OpenAI), HubSpot CRM & Marketing Hub, Gong.io, Drift, Clearbit, Mutiny, Seventh Sense, Zapier, Make (Integromat), Google Analytics 4, Google Ads, Meta Ads Manager, LinkedIn Ads, Hotjar, Mixpanel, Airtable, Slack, Loom, Stripe, ProfitWell, WordPress
Project Year
2025
The Overview
NovaBridge is a B2B SaaS platform offering workforce management and HR automation solutions to mid-market companies across India, Southeast Asia, and the Middle East. With three pricing tiers ($299/mo, $799/mo, $1,499/mo), 620 active paying customers, and a 14-day free trial model, they’d achieved $4.2M in annual recurring revenue (ARR) — impressive for a 3-year-old company, but far below their $10M ARR target.
Their growth was plateauing. Marketing campaigns generated traffic but couldn’t pinpoint which visitors were genuinely ready to buy versus casually browsing. The sales team closed deals based on gut instinct rather than data. Pricing was static despite vastly different customer segments. Trial-to-paid conversion sat at a frustrating 11%. Churn was quietly bleeding revenue at 6.8% monthly. And nobody could definitively answer the most critical business question: “Which of our marketing efforts are actually generating revenue, and which are burning cash?”
NovaBridge didn’t need more marketing tools or another sales training program. They needed artificial intelligence woven into the DNA of their entire revenue engine — from first ad impression to closed deal to long-term retention.
We designed and deployed a holistic AI-powered sales and marketing intelligence system that connects every revenue-generating function — marketing campaigns, website personalization, lead scoring, sales conversations, pricing optimization, churn prediction, and revenue attribution — into a single intelligent ecosystem where AI makes every team member smarter, every decision data-driven, and every dollar more productive.
The Challenge
NovaBridge’s revenue engine was suffering from a interconnected web of inefficiencies:
Marketing-Sales Misalignment: Marketing celebrated “12,000 website visitors this month!” while sales complained “we only got 15 demos worth taking.” Both teams were right — massive traffic was flowing in, but the wrong people were entering the pipeline. Marketing optimized for volume, sales needed quality. There was no shared definition of a “good lead” and no feedback loop between closed deals and the campaigns that generated them.
Blind Campaign Spending: NovaBridge was spending $38,000/month across Google Ads, Meta Ads, LinkedIn Ads, content marketing, webinars, and influencer partnerships — but could only attribute 23% of revenue to specific campaigns. The remaining 77% was a black box. They literally couldn’t tell if their LinkedIn ads were generating $50K in pipeline or $0.
Static, One-Size-Fits-All Website: Every visitor saw the exact same website regardless of whether they were a 50-person startup, a 500-person enterprise, a first-time visitor, or a returning trial user. The homepage featured generic messaging that resonated with nobody specifically because it tried to resonate with everybody.
Gut-Based Sales Process: Sales reps relied on intuition to prioritize deals, choose talk tracks, determine pricing flexibility, and decide when to push versus when to nurture. Top performer Kavitha closed at 32%, while the team average was 14%. Nobody knew what Kavitha did differently because there was no conversation intelligence or behavioral analysis.
Trial Conversion Disaster: 2,400 users started free trials monthly, but only 264 converted to paid (11% conversion rate). The trial experience was identical for everyone — no behavior-triggered nudges, no personalized onboarding, no AI-driven intervention when users showed signs of disengagement. Users who explored only one feature got the same treatment as power users exploring every module.
Revenue Leaking Through Churn: Monthly churn rate of 6.8% meant NovaBridge was losing approximately 42 customers per month — $156,000 in monthly recurring revenue walking out the door. There was no early warning system, no proactive intervention, and no AI-powered retention strategy.
Rigid Pricing Model: All three pricing tiers were static — same price for every company regardless of size, region, purchasing power, competitive alternatives, or lifetime value potential. NovaBridge was simultaneously undercharging enterprise customers (leaving money on the table) and overcharging smaller companies (losing them to cheaper competitors).
No Predictive Revenue Intelligence: The leadership team had no visibility into future revenue. Quarterly forecasts were based on pipeline “vibes” — sales reps manually estimating deal probability. Actual vs. forecast accuracy was off by 35-50% every quarter, making business planning nearly impossible.
Content Marketing Guesswork: The content team published 12 blog posts per month, 3 case studies per quarter, and hosted 2 webinars monthly — but had no data on which content pieces actually influenced purchase decisions. Were those deep-dive technical blogs generating pipeline, or was it the lightweight LinkedIn carousels?
Sales Coaching Gap: New sales reps took 4-5 months to reach full productivity. There was no structured analysis of successful calls, no AI-identified winning patterns, and no real-time coaching during live conversations.
Our Approach & Strategy
We structured this transformation into seven phases, each building a critical layer of the AI-powered revenue intelligence system:
Phase 1: Revenue Data Audit & Infrastructure Setup (Week 1)
Before building AI-powered systems, we needed clean, connected data:
Data Source Inventory & Connection:
Audited all 14 revenue-related data sources:
Data Source
Data Type
Status Before
Action Taken
HubSpot CRM
Deals, contacts, pipeline
Partially used, dirty data
Deep clean + restructure
Google Analytics 4
Website traffic, behavior
Installed but misconfigured
Reconfigured with enhanced ecommerce
Stripe
Payment, subscription, churn data
Connected but not analyzed
Full API integration
ProfitWell
Revenue metrics, MRR, churn
Not installed
New installation + historical import
Google Ads
Campaign performance
Running but no CRM connection
Connected to HubSpot
Meta Ads
Campaign performance
Running but no CRM connection
Connected to HubSpot
LinkedIn Ads
Campaign performance
Running but no CRM connection
Connected to HubSpot
Mixpanel
Product usage analytics
Installed but unused
Activated + event tracking configured
Hotjar
User behavior recordings
Installed but unused
Activated + funnel recording setup
Intercom
Chat conversations
Basic setup
Enhanced with AI triggers
Calendly
Demo bookings
Standalone
Integrated with HubSpot
Gong.io
Sales call recordings
Not installed
New installation
Slack
Team communication
Standard use
AI alerts + notifications added
WordPress
Website, blog, landing pages
Basic setup
Enhanced tracking + personalization prep
Spent 3 full days cleaning HubSpot CRM:
Removed 4,200 duplicate contacts
Standardized company names, industries, and sizes
Filled in missing data fields using Clearbit enrichment
Rebuilt pipeline stages with clear entry/exit criteria
Created custom properties for AI scoring fields
Unified Data Layer:
Built a central data warehouse in Airtable connecting all 14 sources via Zapier and Make automations
Every customer touchpoint — from first ad click to payment renewal — now flows into a single unified record
Created a Customer Journey Map for every account showing every marketing touch, sales interaction, product usage event, and support ticket in chronological order
We transformed NovaBridge’s marketing from “spray and pray” into precision-guided, AI-optimized campaigns:
Multi-Touch Revenue Attribution Model:
Implemented a data-driven attribution model replacing last-click attribution:
Tracks every touchpoint across the full customer journey (average of 14 touchpoints before purchase)
Uses AI to calculate the weighted contribution of each touchpoint to revenue:
EXAMPLE: Customer "TechFlow Solutions" — $799/mo Deal
━━━━━━━━━━━━━━━━━━━━━━━━━━━━━━━━━━━━━━━━━━━━━━━━━━━
Touchpoint Journey:
  1. Google Ad Click (branded keyword)        → 4% attribution
  2. Blog Post Read: "Top HR Challenges 2025" → 8% attribution
  3. LinkedIn Ad Impression (retargeting)      → 3% attribution
  4. Webinar Registration + Attendance         → 18% attribution
  5. Case Study Download (Manufacturing)       → 14% attribution
  6. Email Nurture (3 emails opened)           → 9% attribution
  7. Pricing Page Visit (2x)                   → 11% attribution
  8. LinkedIn Ad Click (demo offer)            → 7% attribution
  9. Free Trial Signup                         → 12% attribution
  10. Sales Demo Call                          → 14% attribution
━━━━━━━━━━━━━━━━━━━━━━━━━━━━━━━━━━━━━━━━━━━━━━━━━━━
Result: Webinar + Case Study + Sales Demo = 46% of credit
        (Versus old model: 100% credit to last-click "Demo Call")
This immediately revealed that webinars (previously considered “nice to have”) were actually the #1 revenue-driving marketing activity — responsible for 22% of weighted attribution across all deals
Also revealed that Instagram ads (consuming $4,200/month) contributed less than 1% of attributed revenue — leading to immediate budget reallocation
AI Campaign Optimization Engine:
Connected Google Ads, Meta Ads, and LinkedIn Ads to HubSpot CRM pipeline data
Built automated feedback loops:
When a lead from a specific campaign closes as a customer → that campaign’s performance data auto-updates with actual revenue generated (not just clicks or leads)
AI analyzes which ad creatives, audiences, keywords, and placements produce customers with highest LTV (not just highest click-through rates)
“Increase LinkedIn ‘Decision-Maker Manufacturing’ audience by 30% — producing leads with 3.2× higher close rate than average”
“Pause Google Display Network campaign — high impressions but zero pipeline contribution in 90 days”
Content Performance Intelligence:
Every blog post, case study, webinar, and downloadable resource tagged with attribution tracking
AI ranks all content assets by Revenue Influence Score:
Content Asset
Views
Leads
Revenue Influenced
Revenue/View
Case Study: Manufacturing ROI
840
62
$127,400
$151.67
Webinar: HR Automation 2025
320
48
$98,200
$306.88
Blog: Compliance Guide
4,200
18
$14,800
$3.52
Ebook: Digital HR Playbook
1,100
95
$42,600
$38.73
Blog: Company Culture Tips
6,800
4
$0
$0.00
Immediately identified that “Company Culture Tips” blog posts (consuming significant writing time) generated massive traffic but zero revenue — while dense, industry-specific case studies with modest traffic were revenue powerhouses
Seventh Sense Email AI:
Deployed Seventh Sense to optimize email send times for each individual recipient
AI analyzes each contact’s historical open/click patterns and delivers emails at the exact hour and minute they’re most likely to engage
Result: email open rates jumped from 18% to 34%, click rates from 2.1% to 5.8%
Phase 3: Website Personalization & Conversion AI (Week 3)
We transformed NovaBridge’s website from a static brochure into an intelligent, adaptive conversion machine:
Mutiny Website Personalization:
Installed Mutiny to create dynamic, personalized website experiences based on visitor attributes:
Visitor Segment
What They See (Personalized)
What Everyone Saw Before (Generic)
Manufacturing Companies
Hero: “Workforce Management Built for Manufacturing” + Manufacturing case study + Factory floor imagery
STRENGTHS: ✅ Excellent discovery questioning (avg 10 questions/call) ✅ Strong case study usage (referenced in 86% of calls) ✅ Good talk-to-listen ratio (41:59)
AREAS FOR IMPROVEMENT: ⚠️ Pricing introduced too early (avg: 22% into call vs. 65% benchmark) ⚠️ Single-threaded on 71% of deals (benchmark: under 40%) ⚠️ Next steps clarity: vague in 4 of 14 calls
TOP COACHING PRIORITY: 🎯 Delay pricing discussion — practice transition phrases Recommended training: Watch Kavitha's call with TechnoForge (Gong link: [auto-generated])
PREDICTED IMPACT IF ADDRESSED: 📈 +6-8% win rate improvement within 30 days ━━━━━━━━━━━━━━━━━━━━━━━━━━━━━━━━━━━━━━━
Phase 5: Dynamic Pricing & Revenue Optimization AI (Week 5)
Static pricing was leaving money on the table and simultaneously losing price-sensitive segments:
AI-Powered Dynamic Pricing Engine:
Analyzed 620 current customers to understand willingness-to-pay patterns:
Segmented by company size, industry, geography, feature usage depth, and competitive alternatives
Identified that enterprise customers (300+ employees) consistently perceived NovaBridge as “surprisingly affordable” — indicating significant underpricing
Identified that Southeast Asian SMBs (under 75 employees) had 4× higher churn rates, primarily driven by price sensitivity
Re-engage: Day 3 “We noticed you haven’t explored yet” email + Day 5 “What’s holding you back?” survey + Day 10 final value proposition with extended trial offer
Behavioral Email Sequences (Trial Period):
Created 4 distinct email sequences (one per segment) with AI-personalized content:
Each email dynamically references:
Features the user has explored (or hasn’t)
Industry-specific use cases relevant to their company
Similar companies that converted and their results
Specific next step to take in the product right now
In-App AI Assistant:
Deployed an in-app AI chatbot that:
Greets users by name and acknowledges their trial day number
Suggests next features to explore based on their usage pattern
Answers product questions instantly (reducing need to leave the app for help)
Detects confusion patterns (repeated clicks, circular navigation) and offers guided help
On Day 10-12, presents personalized conversion offer based on usage depth and segment
Smart Trial Extension:
Instead of rigid 14-day trial for everyone:
Power Explorers: No extension needed — conversion prompt on Day 10
Focused Users: Offered 7-day extension focused on unexplored features
Slow Starters: Offered 14-day extension with assigned onboarding buddy
Window Shoppers: Offered 21-day extension with “fresh start” onboarding email
Phase 7: Revenue Dashboard & AI Forecasting (Week 7)
The final layer — complete visibility into every revenue metric with AI-powered forecasting:
Executive Revenue Dashboard:
Built in Google Data Studio connected to all data sources:
Top 5 deals most likely to close this week (with AI-recommended actions)
Top 5 at-risk customers requiring intervention
Marketing campaign performance highlights and lowlights
Trial conversion predictions for the week
One key insight or pattern the AI detected
Quarterly AI Strategy Review:
System generates a comprehensive quarterly analysis:
Which ICPs generated highest LTV customers?
Which marketing channels improved or declined?
Which sales behaviors correlated with higher win rates?
Which pricing changes impacted conversion and retention?
Recommended strategic adjustments for next quarter
Key Features Delivered
Feature
Description
Multi-Touch Revenue Attribution
AI-powered attribution model tracking 14+ touchpoints per customer journey, revealing true revenue contribution of every marketing effort
AI Campaign Optimization
Automated feedback loops connecting ad spend to actual closed revenue — with weekly AI-generated budget reallocation recommendations
28 Personalized Website Experiences
Dynamic website content adapting to visitor industry, company size, geography, competitive context, and behavioral history via Mutiny
Sales Conversation Intelligence
Gong.io analyzing every call for winning/losing patterns, auto-generating post-call summaries, and providing real-time coaching prompts
AI Deal Scoring & Forecasting
Every deal automatically scored with AI-predicted close probability — forecast accuracy improved from 55% to 89%
Weekly Sales Coaching Scorecards
AI-generated individual coaching reports identifying strengths, improvement areas, and specific training recommendations for each rep
Dynamic Pricing Engine
AI-optimized pricing with geographic adjustments, company-size scaling, personalized trial-to-paid offers, and enterprise quote generation
Churn Prediction System
22-signal behavioral model scoring every customer daily on churn risk with automated tiered intervention workflows
Trial Conversion AI
4-segment behavioral classification with personalized email sequences, in-app AI assistant, and smart trial extensions
Content Revenue Intelligence
Every content asset ranked by Revenue Influence Score — revealing which blog posts, webinars, and case studies actually drive pipeline
Executive Revenue Dashboard
Real-time dashboard unifying marketing, sales, trial, retention, and revenue metrics with AI-powered forecasting
Monday Morning AI Briefing
Automated weekly intelligence report delivered via Slack with key metrics, top opportunities, risks, and recommended actions
Results & Impact (Projected / Showcase Metrics)
Metric
Before
After
Change
Annual Recurring Revenue (ARR)
$4.2M
$9.5M (projected Year 1)
⬆ 127%
Customer Acquisition Cost (CAC)
$2,400
$1,104
⬇ 54%
Marketing Spend Efficiency (Revenue/$ Spent)
$3.20 per $1 spent
$8.70 per $1 spent
⬆ 172%
Revenue Attribution Visibility
23%
94%
⬆ 309%
Trial-to-Paid Conversion Rate
11%
26%
⬆ 136%
Sales Win Rate (Team Average)
14%
28%
⬆ 100%
Sales Forecast Accuracy
50-65%
87-92%
⬆ 54%
Monthly Churn Rate
6.8%
2.9%
⬇ 57%
Average Deal Size
$680/mo
$1,140/mo
⬆ 68%
Sales Cycle Length
42 days
28 days
⬇ 33%
New Rep Ramp Time
4-5 months
6 weeks
⬇ 70%
Website Conversion Rate
1.8%
4.6%
⬆ 156%
Email Marketing Revenue
$18,000/mo
$52,000/mo
⬆ 189%
Monthly Revenue Saved from Churn Prevention
$0 (no system)
$94,000/mo
—
📋 Case Study Summary
Challenge: NovaBridge SaaS had stalled at $4.2M ARR with a disconnected revenue engine — blind marketing spend ($38K/mo with 77% unattributed), 11% trial conversion, 14% sales win rate, 6.8% monthly churn, static pricing leaving money on the table, and zero predictive revenue intelligence.
Solution: We built a holistic AI sales and marketing intelligence system — multi-touch revenue attribution, 28 personalized website experiences, Gong.io-powered sales coaching with AI scorecards, dynamic pricing with geographic and size-based adjustments, churn prediction with automated save workflows, trial conversion AI with behavioral segmentation, and a comprehensive revenue dashboard with AI forecasting.
Result: ARR trajectory accelerated toward $9.5M (127% growth). CAC dropped 54%. Trial conversion jumped from 11% to 26%. Sales win rate doubled. Churn cut by 57%, saving $94K/month in retained revenue. Forecast accuracy reached 89%. Every marketing dollar now returns $8.70 in revenue versus $3.20 previously.
Ready to Turn Your Sales & Marketing Into an AI-Powered Revenue Machine?
We build intelligent systems that connect every revenue function — marketing, sales, pricing, conversion, and retention — into a unified AI engine that makes every team member smarter, every campaign more effective, and every dollar more productive.