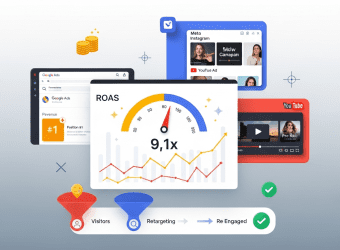
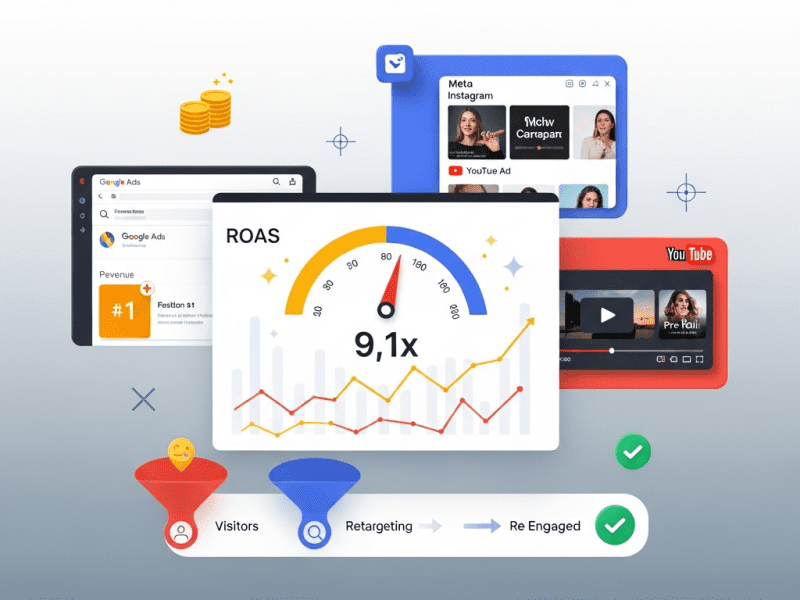
We built and managed a multi-platform paid advertising system for UrbanStay Serviced Apartments — reducing cost per booking by 62%, increasing ROAS from 2.4× to 9.1×, and scaling monthly ad-driven revenue from $38,000 to $142,000 across Google, Meta, and YouTube.
Google Ads, Meta Ads Manager (Facebook + Instagram), YouTube Ads, Google Analytics 4, Google Tag Manager, Google Looker Studio, SEMrush, SpyFu, Unbounce, Hotjar, ChatGPT API (OpenAI), Canva, CapCut Pro, Zapier, HubSpot CRM, Google Sheets, Airtable, Slack, WordPress
Project Year
2025
The Overview
UrbanStay operates 120 premium serviced apartments across Bangalore, Hyderabad, and Pune — targeting business travelers, relocating professionals, and medical tourists seeking furnished, hotel-alternative stays of 3-30+ nights. Average booking value: $680. Monthly marketing budget: $18,000 across Google Ads and Facebook Ads.
Despite spending $18,000/month, UrbanStay was barely breaking even on paid advertising. Their Google Ads account was a graveyard of bloated campaigns with 2,400+ keywords (most irrelevant), broad match types bleeding budget on unqualified searches, and zero negative keyword management. Their Facebook Ads consisted of boosted posts with no audience strategy, no funnel alignment, and no conversion tracking. YouTube — their highest-potential platform for showcasing beautiful apartments — was completely untouched.
The result: Cost per booking of $186 on a $680 average booking value. After operational costs and commissions, each ad-acquired booking generated almost zero profit. The marketing team was spending $18,000/month to essentially run in place.
We rebuilt the entire paid advertising operation from the ground up — auditing and restructuring every campaign, fixing conversion tracking, building proper audience targeting, creating platform-specific creative strategies, launching YouTube ads, implementing a retargeting funnel, and establishing data-driven optimization processes that turned paid ads from a cost center into UrbanStay’s most profitable growth engine.
The Challenge
Google Ads Chaos:
2,400+ keywords across 14 campaigns with no logical structure
68% of keywords on broad match — triggering for irrelevant searches like “cheap hotel rooms,” “free stay,” “apartment for sale”
Zero negative keywords in 18 months of running
Search term report revealed 42% of clicks came from completely irrelevant queries
No ad extensions configured (sitelinks, callouts, structured snippets, location, call)
Single landing page (homepage) for all ads regardless of keyword intent
No conversion tracking — optimizing for clicks, not bookings
Monthly Google Ads spend: $12,000 | Trackable bookings: ~38 | Cost per booking: $316
Meta Ads Negligence:
All “campaigns” were boosted posts — no Ads Manager campaigns with proper objectives
No Meta Pixel installed — zero conversion tracking
Audience targeting: “All India, Age 18-65” (essentially no targeting)
No retargeting audiences built
Creative: static property photos with no compelling copy or CTA
Monthly Meta spend: $6,000 | Trackable bookings: ~26 | Cost per booking: $231
Zero Retargeting: 94% of website visitors left without booking. With 8,400 monthly visitors, that’s ~7,900 interested prospects vanishing with zero follow-up. No retargeting pixels installed on any platform.
No YouTube Presence: Serviced apartments are highly visual products — YouTube is the ideal platform for virtual tours, testimonials, and lifestyle content. Yet UrbanStay had zero YouTube ad presence despite competitors running successful video campaigns.
Landing Page Disaster: Every ad — regardless of whether someone searched “serviced apartment Bangalore,” “corporate housing Hyderabad,” or “monthly stay Pune” — landed on the generic homepage. No city-specific landing pages, no intent-matched messaging, no booking-focused design.
Attribution Black Hole: No proper conversion tracking meant the team couldn’t distinguish between campaigns generating bookings and campaigns burning cash. Budget allocation was based on gut feeling, not data.
Competitive Disadvantage: Top 3 competitors had:
Structured Google Ads with dedicated landing pages per city
Professional Meta Ads with video creatives and lookalike audiences
YouTube pre-roll ads with virtual apartment tours
Retargeting across all platforms
Average CPA 40-60% lower than UrbanStay
Our Approach & Strategy
Phase 1: Tracking Foundation & Competitive Intelligence (Week 1)
Conversion Tracking Infrastructure:
Platform
Tracking Implemented
Conversion Events
Google Ads
Enhanced conversions via GTM
Booking completed (primary), booking form started, phone call click, WhatsApp click, date search initiated
Video views (25/50/75/100%), website visit from video, booking from video viewer
Google Analytics 4
Enhanced e-commerce configured
Full booking funnel: property view → date selection → form start → form complete → booking confirmed
HubSpot CRM
Zapier integration
Every booking lead auto-created with source attribution — connecting ad click to closed booking
Competitive Intelligence Audit (SEMrush + SpyFu):
Competitor
Monthly Ad Spend (Est.)
Top Keywords
Creative Strategy
Gap/Opportunity
Competitor A
$22,000
“serviced apartments bangalore,” “corporate stay”
Video tours + testimonial ads
Strong on search, weak on retargeting
Competitor B
$15,000
“furnished apartments,” “monthly rentals”
Professional photography + carousel
No YouTube presence
Competitor C
$18,000
“business traveler accommodation”
Lifestyle video ads + UGC
Weak landing pages (homepage only)
Key Insight: No competitor had a fully integrated multi-platform strategy with dedicated landing pages + retargeting + YouTube. This was UrbanStay’s opportunity to leapfrog all three.
Campaign 7: [Retargeting] Website Visitors → Audience: Visited site, didn't book (7-30 day window) → Creative: Dynamic property ads based on pages viewed → Budget: $1,200/month
Campaign 8: [Retargeting] Booking Abandoners → Audience: Started booking form but didn't complete → Creative: "Still interested? Your apartment is waiting" → Budget: $800/month
PERFORMANCE MAX:
Campaign 9: [PMax] All Properties → Asset groups by city with images, videos, headlines → Audience signals: business travelers, relocation, medical travel → Budget: $2,000/month
TOTAL GOOGLE ADS BUDGET: $15,300/month (Reallocated from original $12,000 + $3,300 from Meta optimization savings) ━━━━━━━━━━━━━━━━━━━━━━━━━━━━━━━━━━━━━━━━━━
Ad Copy Strategy (Per Campaign):
Ad Element
Before
After
Headlines
“UrbanStay Apartments” (generic)
“Serviced Apartments in Bangalore — Book Direct & Save 15%” / “Fully Furnished, Wi-Fi, Housekeeping — From ₹3,500/Night”
Descriptions
“We offer apartments. Contact us.”
“120+ Premium Serviced Apartments Across 3 Cities. Ideal for Business Travelers & Relocations. Flexible 3-30+ Night Stays. Book Direct for Best Rates. Free Airport Pickup on Stays 7+ Nights.”
15 headlines + 4 descriptions per RSA — Google auto-optimizes combinations
Bid Strategy Shift:
Before
After
Why
Manual CPC (set and forget)
Target CPA (automated)
Let Google’s AI optimize for actual bookings, not clicks
Optimizing for clicks
Optimizing for conversions (bookings)
Only pay effectively for what matters
Same bid every keyword
Bid adjustments by device (+20% mobile), location, time of day, audience
Higher bids when conversion probability is highest
Quality Score Improvement Plan:
Factor
Before (Avg 3.8)
After (Avg 7.4)
How
Ad Relevance
Below average
Above average
Tight keyword-to-ad matching, specific ad copy per ad group
Landing Page Experience
Below average
Above average
City-specific landing pages matching ad intent
Expected CTR
Below average
Above average
Compelling ad copy, extensions, RSA optimization
Phase 3: Meta Ads Strategy & Build (Week 3)
Campaign Architecture (Full-Funnel):
META ADS FUNNEL ARCHITECTURE ━━━━━━━━━━━━━━━━━━━━━━━━━━━━
TOFU — AWARENESS (30% of budget — $1,800/month) ━━━━━━━━━━━━━━━━━━━━━━━━━━━━━━━━━━━━━━━━━━━━━ Campaign: Brand Awareness — Video Views → Objective: Video Views (ThruPlay) → Creative: 30-60 sec apartment tour videos (3 per city) → Audience: • Interest: Business travel, corporate housing, relocation • Lookalike: 1% of past bookers • Demographics: Age 25-55, income targeting → Goal: Build awareness pool for retargeting
Homepage visitors → Google Display: Brand awareness banner (didn't go deeper) Meta: Video tour of featured apartments YouTube: "Discover UrbanStay" pre-roll
Property page viewers → Google Display: Dynamic ad showing viewed property (browsed specific city) Meta: Carousel of apartments in that city YouTube: City-specific tour video
Date search initiated → Google Display: "Apartments available for your dates!" (checked availability) Meta: Urgency ad — "Limited availability for [dates]" Email: If captured — availability confirmation
Booking form started → Google Display: "Complete your booking — special offer inside" (abandoned form) Meta: "Your apartment is still available" with discount Email: If captured — abandoned booking recovery (3-email sequence) SMS: If captured — 24-hour booking reminder
Past guest → Google Display: "Welcome back" loyalty offer (stayed previously) Meta: "Book your next stay — loyal guest discount" Email: Replenishment email based on past stay patterns YouTube: "What's new at UrbanStay" update video
CROSS-PLATFORM FREQUENCY CAP: Max 4 retargeting impressions/day/person (prevents ad fatigue and annoyance) ━━━━━━━━━━━━━━━━━━━━━━━━━━━━━━━━━━━━━━━━━━━━━
Cross-Platform Budget Orchestration:
Platform
Monthly Budget
% of Total
Primary Role
Google Search
$11,300
44%
Capture high-intent searches (bottom funnel)
Google Display/Remarketing
$2,000
8%
Retarget website visitors
Google PMax
$2,000
8%
AI-optimized cross-network reach
Meta Ads (TOFU)
$1,800
7%
Awareness — video tours, lookalike audiences
Meta Ads (MOFU)
$1,800
7%
Consideration — testimonials, carousels
Meta Ads (BOFU)
$2,400
9%
Conversion — retargeting, offers
YouTube Ads
$4,000
15%
Brand building + retargeting (high-impact visual)
Testing Budget
$700
2%
Reserved for new creative/audience tests
Total
$26,000/month
100%
Budget increased from $18,000 to $26,000 — justified by improved efficiency making each dollar work 3-4× harder. At the new ROAS of 9.1×, the additional $8,000 generates approximately $72,800 in additional revenue.
Views, VTR (view-through rate), cost per view, website visits from video, bookings attributed
Landing Pages
Conversion rate per landing page, bounce rate, form completion rate, time on page
Retargeting
Audience size, frequency, conversion rate, ROAS — by segment (viewers vs. abandoners vs. past guests)
Testing
Active tests, completed tests, winning variants, cumulative performance lift
Competitor Monitor
Competitor ad visibility, estimated spend, new creative detected
Budget Pacing
Daily/weekly spend vs. budget, projected month-end spend, over/under alerts
Automated Alerts:
Alert
Trigger
Action
CPA spike
Any campaign CPA exceeds target by 30%+ for 2 days
Slack alert → investigate + pause if needed
Budget pacing
Campaign on track to overspend by 15%+
Slack alert → adjust daily budget
Quality Score drop
Any keyword QS drops below 5
Slack alert → audit ad relevance + landing page
Creative fatigue
Any ad CTR drops 25%+ from peak
Slack alert → refresh creative
Conversion tracking error
Zero conversions recorded for 24 hours (unusual)
Slack urgent alert → check GTM/pixel
Competitor new campaign
SpyFu detects competitor launching new keyword set
Slack weekly digest → evaluate response
High performer detected
Any campaign exceeds ROAS 12×+ for 3 days
Slack celebration 🎉 → increase budget 20%
Monthly AI Strategy Report:
URBANSTAY PPC INTELLIGENCE — MARCH 2025
━━━━━━━━━━━━━━━━━━━━━━━━━━━━━━━━━━━━━━━

📊 OVERALL: Excellent (ROAS: 9.1× | Target: 7×)

💰 REVENUE & SPEND:
  Total ad spend: $26,000
  Total ad-attributed revenue: $142,480
  Blended ROAS: 9.1× (↑ from 8.4× Feb)
  Total bookings from ads: 204 (↑ from 186 Feb)
  Cost per booking: $127 (↓ from $142 Feb)

🏆 TOP PERFORMERS:
  1. Google Search [Bangalore]: ROAS 12.4× — 68 bookings
  2. Meta Retargeting [Booking Abandoners]: ROAS 18.6× — 24 bookings
  3. YouTube In-Stream [Apartment Tours]: ROAS 6.8× — building pipeline

📉 UNDERPERFORMERS:
  • Google Search [Generic/Non-Branded]: ROAS 3.2× — refine keywords
  • Meta TOFU [Interest Targeting]: High reach, low conversion —
    test new interest combinations

🧪 TEST RESULTS:
  • "Free Airport Pickup" offer beat "15% discount" by 34% conversion rate
  • Testimonial video ads outperformed tour videos by 28% CTR on Meta
  • Bangalore landing page with pricing visible: +22% conversion vs. hidden

🎯 NEXT MONTH ACTIONS:
  1. Increase Bangalore search budget 20% (highest ROAS city)
  2. Roll out "Free Airport Pickup" offer across all campaigns
  3. Shift Meta TOFU budget toward testimonial-style creatives
  4. Launch dedicated "Medical Stay" campaign for Bangalore hospitals
  5. Test YouTube Discovery ads targeting relocation-related searches
  6. Create dynamic remarketing for Pune (currently only static ads)

💡 BUDGET RECOMMENDATION:
  Increase total budget to $30,000 (+$4,000)
  Additional $4K allocated to Bangalore Search (+$2K) and
  YouTube retargeting (+$2K) — projected incremental
  revenue: $36,000+ at current ROAS levels
━━━━━━━━━━━━━━━━━━━━━━━━━━━━━━━━━━━━━━━━━━
Key Features Delivered
Feature
Description
Full Google Ads Rebuild
2,400 chaotic keywords restructured into 9 strategic campaigns with city-specific targeting, competitor campaigns, and Performance Max — Quality Score improved from 3.8 to 7.4
Segmented retargeting across Google, Meta, and YouTube — different messaging for homepage visitors, property viewers, date searchers, booking abandoners, and past guests
840+ Negative Keywords
Comprehensive negative keyword list eliminating $2,800/month in previously wasted spend on irrelevant searches
Conversion Tracking Infrastructure
End-to-end tracking from ad click to confirmed booking with revenue attribution across all platforms via GTM, Pixel, CAPI, and CRM integration
Structured Testing Program
Systematic A/B testing across ad copy, landing pages, audiences, creatives, bid strategies, and offers with weekly optimization rhythm
Cross-Platform Budget Orchestration
Data-driven budget allocation across Google, Meta, and YouTube with weekly rebalancing toward highest-performing channels
PPC Performance Dashboard
Real-time Looker Studio dashboard tracking revenue, cost efficiency, platform performance, landing pages, retargeting, and competitor monitoring
Automated Alert System
Instant notifications for CPA spikes, budget pacing, QS drops, creative fatigue, tracking errors, and high-performance detection
Monthly AI Strategy Report
ChatGPT-generated analysis with performance summary, winners, underperformers, test results, and budget recommendations
Challenge: UrbanStay spent $18,000/month on paid ads with a dismal 2.4× ROAS — 2,400 chaotic Google Ads keywords with 42% irrelevant clicks, boosted Facebook posts with zero conversion tracking, no YouTube presence, no retargeting, all ads landing on the generic homepage, and a $186 cost per booking on $680 average booking value.
Solution: We rebuilt the entire paid advertising operation — restructured Google Ads into 9 precision campaigns, built a full-funnel Meta Ads strategy with proper Pixel/CAPI tracking, launched YouTube ads with 12 video creatives, created 8 intent-matched landing pages, deployed multi-platform retargeting across 5 visitor segments, implemented 840+ negative keywords, and established a data-driven weekly optimization rhythm with AI-powered monthly strategy reports.
Result: ROAS improved from 2.4× to 9.1×. Cost per booking dropped 62% ($186 to $71). Monthly ad-attributed revenue grew from $38,000 to $142,000. Bookings from ads tripled. Landing page conversion increased 367%. $2,800/month in wasted spend eliminated. YouTube ads generate 28 bookings/month. Retargeting converts at 4.8%. Annual ad-attributed revenue trajectory: $1.7M.
Burning Money on Ads That Don’t Convert? Let’s Fix That.
We audit, rebuild, and manage paid advertising campaigns across Google, Meta, and YouTube — eliminating wasted spend, fixing conversion tracking, building retargeting funnels, and optimizing relentlessly until every ad dollar works harder than the last.
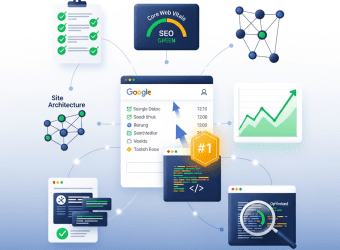
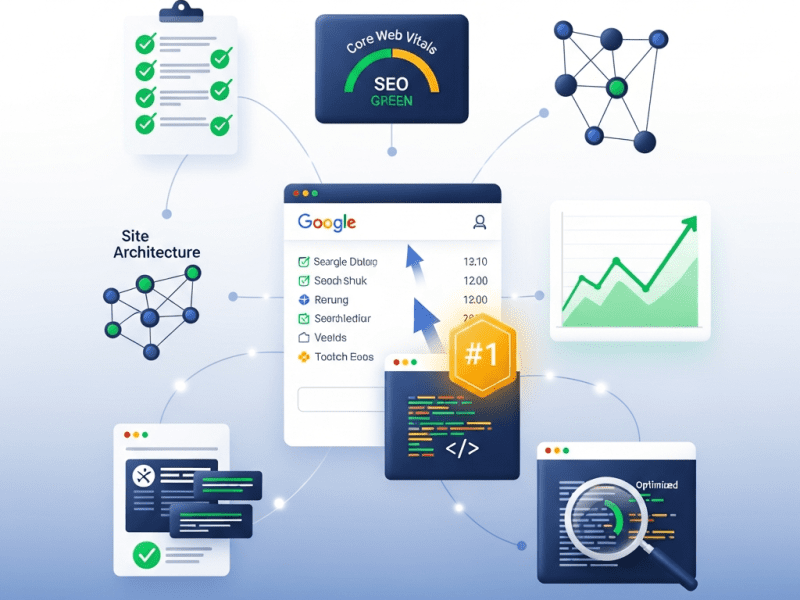
We executed a full-scale SEO transformation for LegalShield India — fixing 142 technical errors, optimizing 85 pages, building 120+ authoritative backlinks, and growing organic traffic from 3,200 to 28,400 monthly sessions with a 640% increase in qualified lead generation from search.
Technical SEO Audit & Fix, On-Page SEO Optimization, Keyword Strategy & Content Mapping, Link Building Campaign, Site Architecture Restructuring, Schema Markup Implementation, Core Web Vitals Optimization, SEO Reporting & Monitoring
Tools & Platforms Used
Ahrefs, SEMrush, Screaming Frog, Google Search Console, Google Analytics 4, Google PageSpeed Insights, GTmetrix, SurferSEO, Yoast SEO, WordPress, Google Tag Manager, Google Looker Studio, ChatGPT API (OpenAI), Canva, HARO, Zapier, Slack, Airtable, Notion
Project Year
2025
The Overview
eLegalShield is a full-service law firm with practices in corporate law, intellectual property, real estate, family law, immigration, and dispute resolution. With 18 attorneys and a strong offline reputation built over 12 years, they were the firm people recommended in person — but online, they were practically invisible.
Their website had been built 4 years ago and never touched since. It had 62 pages of thin, unoptimized content, a crawl error rate of 23%, page load times exceeding 8 seconds, zero backlinks from authoritative sources, and no discernible keyword strategy. When potential clients searched “corporate lawyer Mumbai,” “IP attorney India,” or “divorce lawyer near me” — eLegalShield didn’t appear anywhere in the first 5 pages of results.
Meanwhile, competitors with weaker legal expertise but stronger digital presence were capturing thousands of high-intent searches every month. In legal services, where a single client can be worth $5,000-$50,000+, every first-page ranking represents significant revenue potential.
We executed a comprehensive SEO transformation — fixing every technical issue, restructuring the site architecture, optimizing every page for target keywords, building a strategic backlink profile, and implementing ongoing content and monitoring systems that turned eLegalShield from invisible to dominant in their key practice areas.
Google Core Web Vitals failing on all metrics — direct ranking penalty
Mobile Usability
34 mobile usability errors — text too small, clickable elements too close, content wider than screen
68% of legal searches happen on mobile — terrible experience
Security
Mixed content warnings (HTTP images on HTTPS pages)
Browser security warnings reducing trust
Structured Data
Zero schema markup on any page
No rich snippets, no enhanced search appearance
XML Sitemap
Outdated, including deleted pages, missing new pages
Google crawling phantom pages, missing real ones
On-Page SEO Disaster: Of 62 existing pages:
41 had no meta descriptions
38 had duplicate or missing title tags
52 had no target keyword strategy
47 had zero internal links to/from other pages
28 had thin content (under 300 words) on practice area pages
0 had optimized heading structures (H1/H2/H3)
0 had image alt text
Zero Keyword Strategy: No keyword research had ever been conducted. Page titles were generic — “Corporate Law” instead of “Corporate Lawyer in Mumbai — Business Legal Services.” Content was written for the firm, not for searchers.
Non-Existent Backlink Profile:
Total referring domains: 14 (mostly spam directories)
Domain Authority (Ahrefs DR): 8/100
Zero backlinks from legal publications, news sites, or authoritative directories
Competitors averaged 120-400 referring domains with DR 35-55
Poor Site Architecture: No logical hierarchy. Practice areas, attorney profiles, blog posts, and contact pages all sat at the same URL level with no internal linking strategy. Users and Google bots alike got lost navigating the site.
Content Gaps: Competitors ranked for hundreds of high-intent keywords that eLegalShield had zero content for:
“How to register a trademark in India” — competitor gets 4,200 searches/month
“Divorce process in Mumbai” — competitor gets 2,800 searches/month
“Corporate lawyer fees in India” — competitor gets 1,400 searches/month
eLegalShield had no content addressing any of these topics
Unmeasured Performance: No Google Search Console connected. GA4 installed but misconfigured. No rank tracking. No organic performance baseline. The firm had no idea how they performed in search or what they were missing.
Our Approach & Strategy
Phase 1: Technical SEO Audit & Foundation Repair (Week 1-2)
Visibility comparison vs. 5 competitors, keyword overlap, gap opportunities
ROI Calculation
Organic leads × average client value = estimated revenue from SEO
Automated Monitoring Alerts:
Alert
Trigger
Notification
Ranking Drop
Any top-20 keyword drops 5+ positions
Slack: SEO team
Traffic Anomaly
Organic traffic drops 20%+ vs. 7-day average
Slack + Email: Marketing director
Technical Error
New crawl error, indexation issue, or CWV failure detected
Slack: Dev team + SEO team
New Backlink
High-authority link (DR 40+) acquired
Slack celebration 🎉
Lost Backlink
Any DR 30+ backlink lost
Slack alert: investigate and recover
Competitor Movement
Competitor enters top 3 for priority keyword
Slack: SEO team
Featured Snippet Won
eLegalShield captures new featured snippet
Slack celebration 🏆
Monthly SEO Intelligence Report (AI-Generated):
eLEGALSHIELD SEO INTELLIGENCE — MARCH 2025
━━━━━━━━━━━━━━━━━━━━━━━━━━━━━━━━━━━━━━━━

📊 PERFORMANCE: Excellent (Score: 86/100, ↑9 vs Feb)

🔍 ORGANIC TRAFFIC: 28,400 sessions (↑22% vs Feb)
  Top landing page: "Trademark Registration India" (4,200 sessions)
  Fastest growing: "Divorce Process Mumbai" (↑84% MoM)

📈 RANKINGS:
  Keywords in top 3: 34 (↑8 vs Feb)
  Keywords in top 10: 82 (↑14 vs Feb)
  Keywords in top 20: 128 (↑18 vs Feb)
  Featured snippets: 12 (↑3 vs Feb)
  New #1 positions: "trademark registration India,"
    "corporate lawyer Mumbai," "RERA complaint process"

🔗 BACKLINKS:
  New referring domains: 22 (monthly)
  Domain Rating: 41 (↑4 vs Feb)
  Notable new links: Bar & Bench feature, LiveLaw guest article,
    Mumbai Mirror quote

📞 CONVERSIONS (from organic):
  Form submissions: 186 (↑38% vs Feb)
  Phone calls (tracked): 94 (↑42% vs Feb)
  WhatsApp inquiries: 62 (↑28% vs Feb)
  Total organic leads: 342 (↑36% vs Feb)
  Estimated lead value: 342 × $850 avg = $290,700 potential

💰 SEO ROI:
  Monthly SEO investment: $4,500
  Leads generated: 342
  Cost per organic lead: $13.16
  (vs. Google Ads legal CPC: $8-25 per CLICK, not per lead)
  Estimated revenue from SEO leads (assuming 15% close): $43,605

🎯 NEXT MONTH PRIORITIES:
  1. Target "business lawyer Mumbai" — currently #6, push to top 3
  2. Create immigration law cluster (14 keywords, 8,400 monthly volume)
  3. Build 5 university backlinks via guest lecture program
  4. Refresh "company registration" guide — competitor published newer version
  5. Expand FAQ schema to 10 additional pages
━━━━━━━━━━━━━━━━━━━━━━━━━━━━━━━━━━━━━━━━━━━━━━
Ongoing Optimization Protocol:
Frequency
Activity
Weekly
Rank tracking review, technical error monitoring, competitor movement check
Bi-weekly
2 new blog posts published (ongoing content production)
Monthly
Backlink outreach batch, content refresh on declining pages, performance report
Quarterly
Full technical re-audit, keyword strategy refresh, site architecture review, Core Web Vitals check
Bi-annually
Comprehensive competitor re-analysis, content audit, link profile audit
Key Features Delivered
Feature
Description
142-Issue Technical SEO Fix
Complete resolution of crawl errors, broken links, redirect chains, indexation blocks, mixed content, and mobile usability issues
Core Web Vitals Optimization
LCP from 6.8s to 1.8s, FID from 420ms to 45ms, CLS from 0.34 to 0.04 — all metrics passing Google’s thresholds
Site Architecture Restructuring
Flat 62-page site reorganized into logical hierarchy with 85 optimized pages, 3-click max depth, and strategic internal linking
180-Keyword Strategy
Research-backed keyword map covering informational, commercial, transactional, and local intent across all practice areas
85 Pages Fully Optimized
Every page with keyword-targeted title, meta description, heading structure, content depth, internal links, schema, and image optimization
Challenge: eLegalShield’s website had 142 technical SEO errors, 8-second load times, failing Core Web Vitals, zero keyword strategy, thin content averaging 280 words, only 14 referring domains (DR 8), and no schema markup. They ranked nowhere for any valuable legal keyword — generating just 46 organic leads monthly while competitors dominated search results.
Solution: We executed a comprehensive SEO transformation — fixing all 142 technical issues, optimizing Core Web Vitals (LCP from 6.8s to 1.8s), restructuring site architecture from 62 to 85 optimized pages, mapping 180 keywords across all practice areas, building 120+ quality backlinks from legal publications and media, implementing 9 types of schema markup, producing 38 new content assets, and establishing ongoing monitoring with AI-powered reporting.
Result: Organic traffic grew from 3,200 to 28,400 monthly sessions (788% increase). Keywords in top 3 jumped from 2 to 34. Domain Rating climbed from 8 to 41. Organic leads increased 643% to 342/month at $13.16/lead (vs. $8-25 per click on Google Ads). 12 featured snippets captured. Estimated monthly revenue from SEO: $43,600. All Core Web Vitals now passing. Zero technical errors maintained.
Invisible on Google? Every Day You Don’t Rank, Competitors Get Your Clients.
We execute comprehensive SEO transformations — fixing technical foundations, optimizing every page, building authoritative backlinks, and creating content that ranks — so your ideal clients find you first when they search for what you offer.
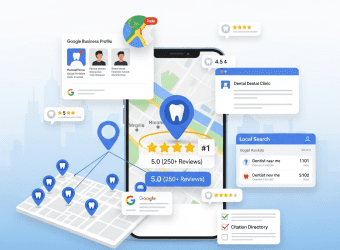
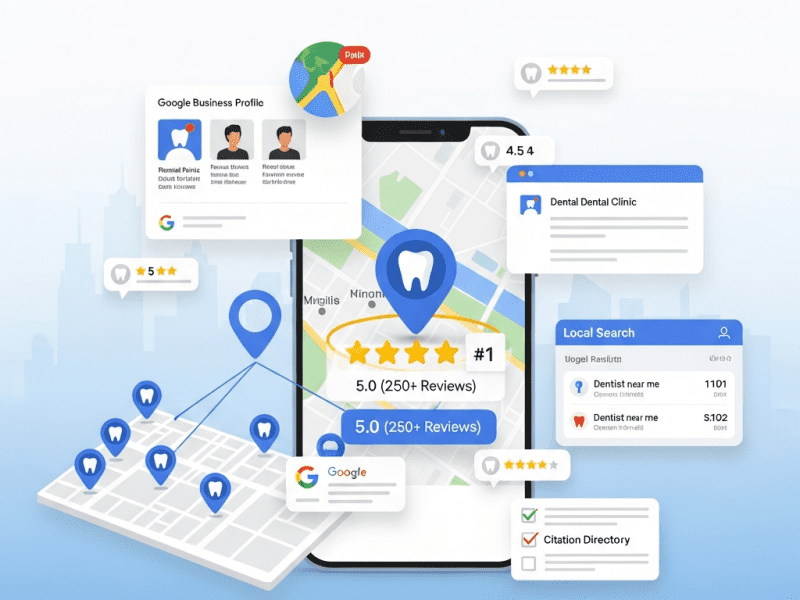
We executed a complete local SEO and Google Business Profile strategy for SparkSmile Dental Group’s 5 clinic locations — achieving top-3 Google Maps rankings for 87% of target keywords, increasing appointment bookings from Google by 214%, and generating 340+ new patient inquiries monthly from local search alone.
Local SEO Strategy, Google Business Profile Optimization, Multi-Location GBP Management, Local Citation Building & Cleanup, Review Generation & Reputation Management, Local Content Strategy, Local Link Building, Google Maps Ranking Optimization, Local Schema Markup, Competitor Analysis & Monitoring
Tools & Platforms Used
Google Business Profile, Google Search Console, Google Analytics 4, BrightLocal, Whitespark, Yext, Moz Local, SEMrush, Ahrefs, ChatGPT API (OpenAI), Zapier, Google Sheets, Airtable, Slack, Podium, WordPress, Yoast SEO, Google Looker Studio, Canva
Project Year
2025
The Overview
SparkSmile Dental Group operates 5 dental clinics across Chennai — in Anna Nagar, T. Nagar, Velachery, OMR (Sholinganallur), and Tambaram. Each clinic offers general dentistry, cosmetic dentistry, orthodontics, dental implants, and pediatric dentistry. With 12 dentists, a strong clinical reputation, and average patient value of $420/year, they had the quality — but patients couldn’t find them online.
When someone in Chennai searched “dentist near me,” “dental clinic Anna Nagar,” or “teeth whitening Chennai,” SparkSmile was invisible. Their Google Business Profiles were incomplete, inconsistent, and unoptimized. Their local SEO was nonexistent. Competitors with inferior clinical quality but superior local marketing were capturing 80%+ of the local search traffic — and converting those searchers into patients that should have been SparkSmile’s.
In local healthcare, visibility equals viability. 76% of people who search for a local business visit within 24 hours. 28% of those searches result in a purchase. SparkSmile was missing this massive stream of high-intent patients every single day.
We built a comprehensive local SEO and Google Business Profile domination strategy across all 5 locations — optimizing every profile, building local authority, generating reviews at scale, creating locally-targeted content, and establishing SparkSmile as the most visible and trusted dental brand in Chennai’s local search results.
The Challenge
Incomplete & Inconsistent Google Business Profiles: All 5 clinic GBPs had critical issues:
Issue
Locations Affected
Impact
Missing or wrong business hours
4 of 5
Patients showing up when clinic closed
Wrong phone numbers
2 of 5
Calls going to disconnected lines
No business description
5 of 5
Zero keyword signals for Google
Missing service categories
5 of 5
Not appearing for specialty searches
Zero Google Posts published
5 of 5
No freshness signals, no offers visible
Low-quality or missing photos
5 of 5
Unappealing profiles vs. competitors
No Q&A section answers
5 of 5
Unanswered questions creating doubt
Missing attributes
5 of 5
Safety protocols, accessibility, payment options not shown
Inconsistent NAP across web
5 of 5
Different name/address/phone across directories killing rankings
Google Maps Invisibility: Rankings across target keywords:
Keyword
Anna Nagar
T. Nagar
Velachery
OMR
Tambaram
“dentist near me”
#18
#22
Not ranked
#15
Not ranked
“dental clinic [area name]”
#12
#14
#20
#11
#19
“teeth whitening Chennai”
Not ranked
Not ranked
Not ranked
Not ranked
Not ranked
“dental implants Chennai”
Not ranked
Not ranked
Not ranked
Not ranked
Not ranked
“best dentist [area name]”
#16
#19
Not ranked
#14
Not ranked
Zero locations in Google’s Local 3-Pack (the top 3 Maps results that capture 44% of all local clicks).
Review Deficit: Average Google rating across locations: 3.8 stars with only 124 total reviews across all 5 clinics (avg 25 per location). Top competitor: 4.7 stars with 680+ reviews at a single location. Reviews are the #1 local ranking factor — SparkSmile was being crushed.
NAP Inconsistency Chaos: Business name, address, and phone (NAP) listed differently across 40+ online directories, maps, and healthcare portals. Google penalizes inconsistent NAP data by reducing local ranking confidence.
No Local Content: Website had zero location-specific pages. No “Dentist in Anna Nagar” page, no “Dental Implants in OMR” page. Without location-targeted content, Google had no reason to show SparkSmile for area-specific searches.
Competitor Domination: Top 3 competitors had invested heavily in local SEO:
Competitor B: 420 reviews, 4.5 stars, active Q&A, professional photos, video tours
Competitor C: 340 reviews, 4.6 stars, strong citation profile, local link building
Zero Tracking: No visibility into how many calls, direction requests, website clicks, or appointments came from Google Business Profiles. No ranking tracking. No review monitoring. Marketing ROI from local search was completely invisible.
Our Approach & Strategy
Phase 1: GBP Audit, NAP Cleanup & Foundation Optimization (Week 1)
Google Business Profile Complete Optimization (All 5 Locations):
Element
Before
After (Optimized)
Business Name
Inconsistent (some had “Dr. Kumar’s SparkSmile”, others just “SparkSmile”)
Standardized: “SparkSmile Dental Clinic – [Area Name]” across all
750-word keyword-rich description unique to each location — mentioning area landmarks, neighborhoods served, specialties, insurance accepted, languages spoken
Hours
Wrong on 4 locations
Verified and corrected, including special hours for holidays and emergency availability
TRIGGER: Patient appointment completed (marked in clinic system)
STEP 1 (2 hours post-appointment): → SMS via Podium: "Hi [Name], thank you for visiting SparkSmile [Location]! We'd love your feedback. It takes just 30 seconds → [Google Review Link]" → Direct link opens Google Review form (pre-selected with SparkSmile's specific location)
STEP 2 (If no review after 48 hours): → Follow-up SMS: "Hi [Name], just a gentle reminder — your review helps other patients find quality dental care. Would you mind sharing your experience? → [Link]"
STEP 3 (If no review after 7 days): → Email follow-up with different angle: "Your opinion matters to us — and to other patients looking for a trustworthy dentist in [Area Name] → [Link]"
STEP 4 (After review posted): → If 4-5 stars: Thank you SMS + response posted on Google within 24 hours (see review response below) → If 1-3 stars: ALERT to clinic manager via Slack → personal phone call within 4 hours to resolve → Professional, empathetic response posted on Google ━━━━━━━━━━━━━━━━━━━━━━━━━━━━━━━━━━━━━━━━━━━━━
Review Response Strategy (Every Review Gets a Response):
Rating
Response Approach
Response Time
Example
⭐⭐⭐⭐⭐
Grateful, personal, mention specific treatment if appropriate, invite to return
Within 24 hours
“Thank you so much, Priya! We’re thrilled your teeth whitening experience at our Anna Nagar clinic exceeded expectations. Dr. Meera will be delighted to hear this. We look forward to seeing you at your next check-up! 😊”
⭐⭐⭐⭐
Thank, acknowledge, ask what could make it 5 stars
Within 24 hours
“Thanks for the kind words, Rajesh! We’re glad you had a positive experience. We’d love to know what would make your next visit a perfect 5-star experience — feel free to let us know! 🦷”
“Thank you for sharing your feedback. We take every comment seriously and would love to understand how we can improve. Could you reach us at [phone] so we can make things right?”
⭐⭐ or ⭐
Empathetic, apologize, take offline immediately, show action
Within 4 hours
“We’re truly sorry about your experience, [Name]. This doesn’t reflect the standard of care we strive for. Our clinic manager [Name] will call you personally today to understand what happened and resolve this. Your satisfaction matters deeply to us.”
AI-Generated Review Responses (ChatGPT):
For efficiency with volume, ChatGPT generates personalized response drafts based on review content
Clinic manager reviews and approves before posting
Each response is unique — no copy-paste templates (Google detects and devalues repeated responses)
Review Growth Targets:
Location
Reviews Before
Monthly Target
6-Month Goal
Anna Nagar
32 reviews, 3.9★
25 new/month
180+ reviews, 4.7★
T. Nagar
28 reviews, 3.7★
25 new/month
175+ reviews, 4.7★
Velachery
22 reviews, 4.0★
20 new/month
140+ reviews, 4.8★
OMR
24 reviews, 3.8★
25 new/month
170+ reviews, 4.7★
Tambaram
18 reviews, 3.6★
20 new/month
135+ reviews, 4.7★
Total
124 reviews, 3.8★ avg
115 new/month
800+ reviews, 4.7★ avg
Phase 3: Local Content Strategy & Location Pages (Week 3)
Profile views, search queries, phone calls, direction requests, website clicks, booking clicks — per location with trend
Rankings
Google Maps position for all target keywords × 5 locations — weekly movement tracking
Reviews
New reviews/month, average rating, response rate, rating trend — per location
Local Traffic
Organic traffic to location pages, service-location pages, local blog posts
Conversions
Appointment bookings from Google, phone calls tracked, WhatsApp inquiries — per location
Citations
Citation count, consistency score, new citations built — per location
Competitor Comparison
Rating, review count, posting frequency, and ranking comparison vs. top 3 competitors
Revenue Attribution
New patient inquiries from local search × average patient value = estimated revenue
Monthly Local SEO Report (AI-Generated):
SPARKSMILE LOCAL SEO — MARCH 2025
━━━━━━━━━━━━━━━━━━━━━━━━━━━━━━━━

📊 OVERALL: Strong Progress (Score: 78/100, ↑12 vs Feb)

🗺️ RANKINGS:
  Keywords in Local 3-Pack: 26 of 30 (87%) — ↑8 vs Feb
  Top keyword: "dentist anna nagar" → Position #1 🏆
  Biggest mover: "dental implants omr" → #14 to #2

⭐ REVIEWS:
  New reviews this month: 128 (target: 115) ✅
  Average rating: 4.72★ (↑ from 4.58★)
  Total reviews across locations: 486 (↑ from 358)
  Response rate: 100%

📞 PATIENT INQUIRIES FROM GOOGLE:
  Phone calls from GBP: 248 (↑34% vs Feb)
  Direction requests: 186 (↑28% vs Feb)
  Website clicks from GBP: 412 (↑42% vs Feb)
  Appointment bookings from local search: 142 (↑52% vs Feb)
  Total local search inquiries: 340+

💰 ESTIMATED REVENUE IMPACT:
  New patients from local search: 142
  Estimated first-visit value: $85 avg
  Estimated annual value per patient: $420
  Projected annual revenue from local search patients:
  142 × $420 = $59,640/month potential LTV

🎯 NEXT MONTH PRIORITIES:
  1. Push "dental implants chennai" into top 3 (currently #4)
  2. Velachery location needs more review focus (lowest count)
  3. Launch "Free Dental Check-Up Camp" event posts across all locations
  4. Build 8 new local backlinks from Chennai health publications
━━━━━━━━━━━━━━━━━━━━━━━━━━━━━━━━━━━━━━━━━━━━━━━━
Key Features Delivered
Feature
Description
5 Fully Optimized Google Business Profiles
Complete optimization — categories, descriptions, services, photos (40+ per location), videos, Q&A, attributes, and appointment links
NAP Consistency Across 85 Directories
Audited and corrected 47 inconsistencies + built 38 new citations ensuring 100% NAP accuracy
Automated Review Generation System
SMS + email review request sequences via Podium generating 115+ new reviews monthly with 100% response rate
Estimated Monthly Patient Revenue (from Local Search)
$18,480
$59,640
⬆ 223%
Review Response Rate
12% (sporadic)
100% (within 24 hours)
⬆ 733%
Google Posts Published/Month
0
125-150 (across 5 locations)
—
📋 Case Study Summary
Challenge: SparkSmile Dental Group’s 5 Chennai clinics were invisible in local search — zero presence in Google’s Local 3-Pack, only 124 reviews at 3.8 stars, NAP inconsistencies across 47 directories, no location-specific web pages, no GBP content strategy, and just 44 appointment bookings monthly from Google. Competitors with 680+ reviews and optimized profiles were capturing all the local search patients.
Solution: We executed a comprehensive local SEO strategy — fully optimizing all 5 Google Business Profiles, cleaning NAP across 85 directories, building an automated review generation system (115+ new reviews/month), creating 35 location-specific web pages with local schema markup, publishing 125+ GBP posts monthly, building 40+ local backlinks, and implementing geo-grid ranking tracking with performance dashboards.
Result: 87% of target keywords now in Google’s Local 3-Pack (from zero). Reviews grew from 124 to 810+ at 4.72 stars. Appointment bookings from Google increased 223% (44 to 142/month). Total local search inquiries tripled to 340+/month. Estimated monthly patient revenue from local search: $59,640 — a 223% increase.
Invisible on Google Maps? Your Competitors Are Getting Your Customers.
We optimize your Google Business Profile, build local authority, generate reviews at scale, and dominate local search results — so when nearby customers search for what you offer, they find you first, trust you most, and choose you every time.
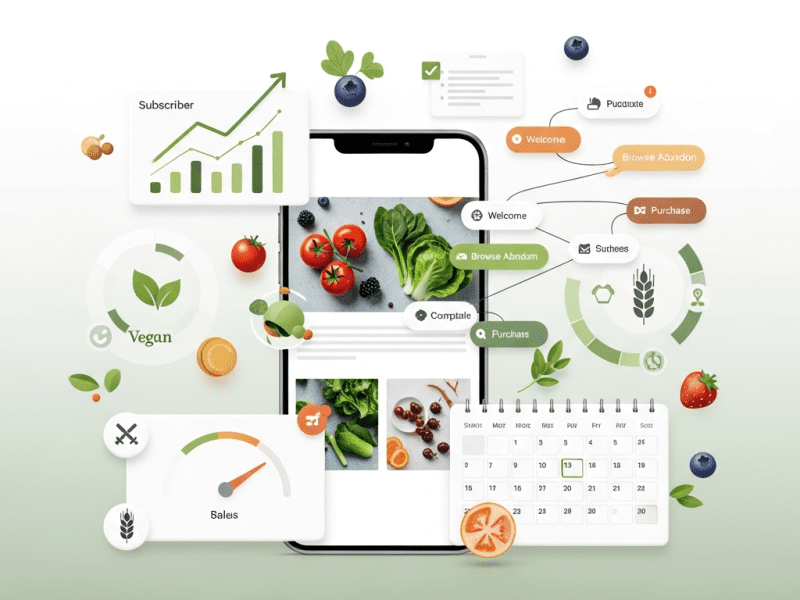
We designed and executed a complete revenue-driven email marketing program for FreshBasket Organic Grocery — growing their list from 8,200 to 24,600 subscribers, increasing email-attributed revenue from 6% to 38% of total sales, and generating $248,000 in email revenue within 5 months.
Klaviyo, WordPress, WooCommerce, Canva, ChatGPT API (OpenAI), Google Analytics 4, Zapier, Typeform, Privy (popups), Google Sheets, Airtable, Notion, Litmus, Google Looker Studio
Project Year
2025
The Overview
FreshBasket is a D2C organic grocery brand delivering premium organic produce, pantry staples, cold-pressed juices, and wellness products to health-conscious consumers across 6 major Indian cities. With 8,200 email subscribers, 2,400 monthly active customers, and average order value of $42, they had a loyal customer base — but their email marketing was barely scratching the surface of its potential.
Their email program consisted of one weekly promotional blast announcing whatever was on sale — same message to everyone, same design every week, with a predictable pattern that subscribers had learned to ignore. Open rates had declined to 12%. Unsubscribe rates were climbing. Email generated just 6% of total revenue — compared to the D2C industry benchmark of 30-40%.
The irony was that FreshBasket had the perfect product for email marketing success — a consumable, repeat-purchase product with natural replenishment cycles, seasonal variety, passionate customers, and rich content opportunities. They just weren’t leveraging any of it.
We built a comprehensive email marketing program — from list growth and segmentation through campaign strategy, lifecycle programs, personalization, and revenue optimization — transforming email from a neglected broadcast channel into FreshBasket’s most profitable owned marketing asset.
The Challenge
Broadcast-Only Approach: One weekly promotional email to the entire list. No segmentation by purchase history, preferences, engagement level, or customer value. A vegan customer received promotions for dairy products. A weekly subscriber received the same email as someone who hadn’t opened in 6 months.
Declining Engagement: Open rates dropped from 22% to 12% over 18 months. Click rates sat at 0.7%. The weekly blast had become invisible — subscribers conditioned to ignore it.
No Lifecycle Marketing: Zero automated programs for critical customer lifecycle moments — no welcome series for new subscribers, no first-purchase follow-up, no win-back for lapsing customers, no replenishment reminders, no birthday/anniversary campaigns. Every customer relationship moment was missed.
List Growth Stagnation: 8,200 subscribers with net growth of just 40-60 per month. No lead magnets, no popup strategy, no referral program, no social-to-email conversion. List was growing slower than attrition was shrinking it.
Revenue Attribution Gap: FreshBasket attributed 6% of revenue to email, but even that number was unreliable. No proper tracking of email-driven purchases, no campaign ROI measurement, no understanding of customer lifetime value by email engagement level.
Design & Content Monotony: Every email looked identical — product grid, discount percentage, shop button. No storytelling, no educational content, no brand personality, no user-generated content, no seasonal themes. Zero reasons for a subscriber to be excited about opening FreshBasket emails.
No Repeat Purchase Strategy: For a consumable product with natural 7-14 day replenishment cycles, there was no system to remind, nudge, or incentivize repeat purchases at the right moment.
Our Approach & Strategy
Phase 1: Email Audit, List Health & Segmentation Architecture (Week 1)
List Health Audit:
Finding
Detail
Action
Total subscribers
8,200
Baseline established
Active (opened in 90 days)
3,400 (41%)
Primary send segment
Inactive (90-180 days)
2,100 (26%)
Re-engagement campaign target
Dead (180+ days no open)
2,700 (33%)
Sunset campaign → suppress or remove
Invalid/bounced emails
380 (5%)
Removed immediately
Missing purchase data
1,800 subscribers with no linked orders
Matched via email → WooCommerce lookup
Spam complaint rate
0.12% (above 0.1% threshold)
Improved by cleaning list + better targeting
Segmentation Architecture (Klaviyo):
Segment
Criteria
Size
Marketing Strategy
VIP Customers
10+ orders OR $500+ lifetime spend
380
Exclusive early access, loyalty rewards, premium content
Early access, feedback surveys, ambassador program
Phase 2: Lifecycle Email Programs (Week 2)
Built 8 lifecycle automation programs addressing every critical customer journey moment:
Program 1: Welcome Series (New Subscribers — 6 emails / 14 days)
Email
Day
Subject
Content
Goal
Welcome
0
“Welcome to FreshBasket 🌿 Here’s 15% off your first order”
Brand story, values, what makes organic different, discount code
First purchase incentive
Discovery
2
“Here’s how 4,200 families eat healthier with FreshBasket”
Customer stories, popular products, “how it works”
Social proof + education
Best Sellers
5
“Our 10 most-loved products (customers’ choice)”
Curated product showcase with reviews
Product discovery
Content Value
8
“3 quick organic meals even busy parents can make tonight”
Recipe content with product links
Value + product integration
Nudge
11
“Your 15% off expires in 3 days — don’t miss out”
Reminder with urgency
Conversion push
Final
14
“Last chance: 15% off + free delivery on your first FreshBasket order”
Final incentive with added free delivery
Last conversion attempt
Welcome Series Target: 28% conversion to first purchase within 14 days
Program 2: Post-First-Purchase (4 emails / 21 days)
Email
Day
Subject
Goal
Thank You
0
“Your first FreshBasket order is on its way! 🚚”
Confirmation, delivery details, what to expect
Tips
3
“How to store your organic produce for maximum freshness”
Education, reduce food waste → reinforce quality
Feedback
7
“How was your first FreshBasket experience?”
NPS survey + review request
Second Order
14
“Time to restock? Here’s 10% off your second order”
Drive repeat purchase habit
Program 3: Replenishment Reminders (Automated by Purchase History)
Product Category
Avg Replenishment Cycle
Reminder Timing
Fresh produce (fruits, vegetables)
7 days
Day 5 email: “Time to restock your weekly greens?”
Dairy & eggs
10 days
Day 8 email: “Running low on organic dairy?”
Pantry staples (grains, oils, spices)
30-45 days
Day 25 email: “Your pantry essentials might need a refresh”
Cold-pressed juices
14 days
Day 12 email: “Ready for your next juice cleanse batch?”
Wellness products (honey, supplements)
45-60 days
Day 40 email: “Time to reorder your wellness favorites”
Smart Replenishment Logic: Klaviyo tracks each customer’s actual purchase intervals — if someone buys eggs every 8 days, they get reminded on day 6 (not the generic day 8).
One-Click Reorder: Replenishment emails include a “Reorder Same Items” button that pre-fills their cart with previous order items.
Name only vs. name + product recs vs. full personalized
Revenue per email
Quarterly
Sender name
“FreshBasket” vs. “Meera from FreshBasket” vs. “FreshBasket Kitchen”
Open rate
Monthly
Email Revenue Attribution (Klaviyo + GA4):
REVENUE ATTRIBUTION MODEL
━━━━━━━━━━━━━━━━━━━━━━━━━

DIRECT ATTRIBUTION (Klaviyo):
  → Customer clicks email link → purchases within 5 days
  → Revenue credited to specific email/campaign
  → Tracked: campaign revenue, flow revenue, total email revenue

INFLUENCED ATTRIBUTION (GA4):
  → Customer opened email (no click) → purchased within 7 days
  → Revenue tracked as "email-influenced" (separate from direct)

METRICS TRACKED:
  → Revenue per email (RPE)
  → Revenue per subscriber (monthly)
  → Revenue per campaign
  → Revenue per flow (lifecycle program)
  → Campaign ROI (revenue vs. production cost)
  → List value (total revenue ÷ total subscribers)
  → Customer LTV by email engagement level
━━━━━━━━━━━━━━━━━━━━━━━━━━━━━━━━━━━━
Email Marketing Dashboard (Looker Studio):
Section
Key Metrics
Revenue
Email-attributed revenue (MTD/QTD), % of total revenue, revenue per subscriber, revenue by campaign type
Growth
Subscriber count trend, growth rate, growth by channel, churn rate
Engagement
Open rate, click rate, unsubscribe rate — trended over time with benchmarks
Lifecycle Performance
Revenue per flow: welcome, replenishment, win-back, VIP, post-purchase
Campaign Performance
Every campaign ranked by revenue, open rate, click rate, unsubscribe rate
List Health
Active vs. dormant ratio, deliverability score, spam complaint rate
Testing
Active tests, completed tests, cumulative lift from testing wins
Key Features Delivered
Feature
Description
8 Lifecycle Automation Programs
Welcome series, post-purchase, replenishment reminders, win-back, VIP loyalty, birthday, review/referral, and sunset — all behavioral and personalized
Smart Replenishment System
AI-powered purchase interval tracking with one-click reorder buttons customized per customer’s actual buying patterns
12-Segment Dynamic Architecture
Audiences segmented by value, lifecycle stage, dietary preference, engagement level, and purchase frequency
Strategic Campaign Calendar
12-month promotional calendar with weekly campaign framework, seasonal campaigns, and Indian festival marketing
6 Branded Email Templates
Reusable, mobile-optimized templates for product launches, promotions, recipes, community, replenishment, and founder notes
Multi-Channel List Growth System
8 list growth tactics projected to add 2,700+ subscribers/month — popups, checkout opt-in, referrals, lead ads, content upgrades
Systematic A/B Testing
Structured testing program across subject lines, timing, design, CTAs, discounts, and personalization depth
Revenue Attribution Dashboard
Real-time tracking of email-direct and email-influenced revenue with campaign-level ROI and subscriber lifetime value analysis
Content-Commerce Integration
Recipes, stories, and educational content with embedded product links — turning every content email into a revenue opportunity
VIP Loyalty Program
Automated recognition, exclusive early access, quarterly gifts, and personalized experiences for top customers
Challenge: FreshBasket’s email marketing was a single weekly blast to 8,200 unsegmented subscribers — 12% open rate, 0.7% click rate, declining engagement, and email generating just 6% of revenue. No lifecycle automations, no replenishment reminders, no win-back campaigns, no list growth strategy, and no revenue attribution.
Solution: We built a complete email marketing program in Klaviyo — 8 lifecycle automation programs (welcome, post-purchase, smart replenishment, win-back, VIP, birthday, referral, sunset), 12 dynamic segments, a 12-month campaign calendar with Indian festival marketing, 6 branded templates, an 8-channel list growth system, systematic A/B testing, and a revenue attribution dashboard.
Result: Subscriber list tripled to 24,600. Open rates jumped from 12% to 34%. Email revenue contribution grew from 6% to 38% of total sales. Cumulative email revenue hit $248,000 in 5 months. Repeat purchase rate nearly doubled. Welcome series converts 28% of new subscribers. Smart replenishment reminders achieve 24% reorder rate. Customer LTV for email-engaged customers is 2.8× higher.
Your Email List Is Your Most Valuable Marketing Asset — Are You Using It?
We build email marketing programs that turn subscribers into customers, one-time buyers into repeat purchasers, and dormant lists into revenue engines — through strategic segmentation, lifecycle automation, and campaigns your audience actually looks forward to opening.
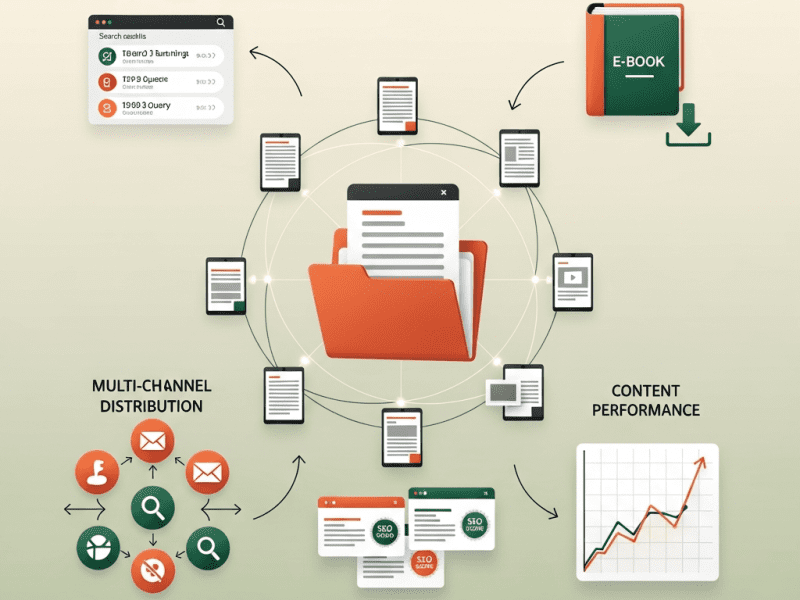
We built a strategic content marketing engine for ZenithCloud SaaS — developing a topic authority framework, producing 48 SEO-optimized content assets, and generating 2,840 organic leads in 6 months with content that ranks, converts, and compounds.
Content Strategy Development, SEO-Driven Content Planning, Blog & Long-Form Content Production, Content Distribution Framework, Lead Magnet Creation, Content Repurposing System, Performance Measurement & Optimization
Tools & Platforms Used
WordPress, Yoast SEO, SurferSEO, Ahrefs, SEMrush, Google Analytics 4, Google Search Console, ChatGPT API (OpenAI), Canva, Google Looker Studio, Notion, Airtable, Buffer, ActiveCampaign, Zapier, Make (Integromat), Google Sheets, Loom
Project Year
2025
The Overview
ZenithCloud is a B2B SaaS platform offering cloud-based project management and team collaboration tools for agencies, IT companies, and professional services firms. With 3,200 active users, a freemium model (free tier + $29/user/month Pro + $59/user/month Enterprise), and a competitive landscape dominated by established players like Asana, Monday.com, and ClickUp, they needed a sustainable acquisition channel beyond paid ads.
Their paid advertising was generating users at $68 cost per acquisition — but LTV for free-tier users averaged only $42 (most never converted to paid). The unit economics were upside down. Meanwhile, competitors were dominating organic search results, publishing 30-50 content pieces monthly, building topical authority, and acquiring users at near-zero marginal cost through SEO-driven content.
ZenithCloud’s content marketing consisted of a sporadic company blog with 22 posts published over 18 months — mostly product announcements, company news, and generic productivity tips. Total organic traffic: 1,400 visitors/month. Organic signups: 12/month. Content-attributed revenue: effectively zero.
We designed and executed a comprehensive content marketing engine — from strategy and topic architecture to production, optimization, distribution, and performance measurement — transforming ZenithCloud’s blog from a dusty afterthought into their most efficient and scalable customer acquisition channel.
The Challenge
Zero Topical Authority: Google didn’t recognize ZenithCloud as an authority on any topic. With only 22 scattered posts covering random subjects, there was no topic depth, no content clusters, and no semantic relevance signals. Competitors had 300-800+ indexed pages on project management topics.
No Content Strategy: Content was published reactively — “we need a blog post this week, write about anything.” No keyword research, no audience mapping, no funnel alignment, no editorial calendar. Every post was a standalone island with no strategic connection.
Wrong Content for Wrong Audience: Of the 22 existing posts, 14 were product announcements (interesting only to existing users), 5 were generic productivity tips (no competitive advantage), and 3 were company news (nobody outside the company cared). Zero posts targeted buyer-intent keywords. Zero posts addressed prospect pain points.
SEO-Blind Content: Not a single post had been optimized for search. No target keywords, no meta descriptions, no internal linking, no heading structure optimization, no content scoring. Average SurferSEO content score: 18/100.
No Lead Capture from Content: Blog posts had no CTAs, no lead magnets, no email capture, no content upgrades. Even the few visitors who found the blog had no path from “reading” to “becoming a lead.”
No Distribution Strategy: Posts were published and forgotten. No social sharing system, no email newsletter, no content syndication, no repurposing. A post that took 6 hours to write reached maybe 80 people.
Unmeasurable Impact: No content performance tracking. Nobody knew which posts generated traffic, which generated signups, and which generated zero value. Content investment couldn’t be justified because ROI was invisible.
CLUSTER 1: "Agency Project Management" (Primary) PILLAR: Ultimate Guide to Agency Project Management (5,000 words) CLUSTERS (10 posts): → How to manage multiple client projects simultaneously → Agency resource allocation: frameworks that work → Client communication best practices for agencies → Project profitability tracking for agencies → How to prevent scope creep in agency projects → Agency workflow templates (with downloads) → Time tracking for agencies: complete guide → Remote agency team management → Agency project management tool comparison [2025] → How to scale an agency without burning out your team
CLUSTER 2: "Team Productivity & Collaboration" PILLAR: The Complete Guide to Team Productivity (4,500 words) CLUSTERS (8 posts): → Async vs. sync communication: when to use each → How to run effective project kickoff meetings → Cross-functional collaboration frameworks → Meeting-free productivity: realistic strategies → Team workload balancing techniques → Project handoff checklist and templates → How to reduce tool overload in your team → Building a culture of accountability in remote teams
CLUSTER 3: "Project Management Best Practices" PILLAR: Project Management Fundamentals for Growing Teams (4,000 words) CLUSTERS (8 posts): → Agile vs. Waterfall vs. Hybrid: choosing right methodology → Project timeline estimation: techniques that actually work → Risk management for project managers → Stakeholder management complete guide → Project retrospectives: templates and frameworks → How to create SOPs that teams actually follow → Dependency management in complex projects → KPIs every project manager should track
CLUSTER 4: "Tool Comparisons & Alternatives" (Bottom-Funnel) PILLAR: How to Choose the Right Project Management Tool (3,500 words) CLUSTERS (6 posts): → ZenithCloud vs. Asana: detailed comparison [2025] → ZenithCloud vs. Monday.com: which is right for you? → ZenithCloud vs. ClickUp: features, pricing, verdict → Best project management tools for agencies [2025] → Best project management tools for IT teams [2025] → Switching project management tools: migration guide
ZENITHCLOUD CONTENT MARKETING — MARCH 2025 ━━━━━━━━━━━━━━━━━━━━━━━━━━━━━━━━━━━━━━━━━
📊 TRAFFIC: 18,400 organic sessions (↑34% vs Feb) 📈 RANKINGS: 31 of 48 keywords in top 10 (↑8 vs Feb) 📧 LEADS: 486 content-attributed leads (↑41% vs Feb) 💰 REVENUE: $14,200 attributed to content-sourced signups
Challenge: ZenithCloud’s content marketing was nonexistent — 22 scattered blog posts over 18 months, zero SEO strategy, zero lead capture, 1,400 organic visitors monthly, and paid acquisition costs of $68/user making growth unsustainable against established competitors with 300-800+ content pages.
Solution: We built a strategic content engine with 5 topic clusters targeting “project management for agencies,” produced 48 SEO-optimized assets (pillar pages, cluster posts, lead magnets) using an AI-augmented workflow, implemented lead capture flows with topic-specific nurture sequences, created a 9-channel distribution system with automated repurposing, and built a performance dashboard with content scoring and AI-generated monthly intelligence reports.
Result: Organic traffic grew from 1,400 to 24,600/month in 6 months. Keywords in top 10 jumped from 3 to 31. Content generated 2,840 cumulative leads at $6.80/lead (vs. $68 paid). Monthly content-attributed revenue reached $14,200. Domain authority increased 58%. Content became ZenithCloud’s most efficient acquisition channel — 10× cheaper than paid ads.
Ready to Build a Content Engine That Generates Leads While You Sleep?
We design and execute strategic content marketing programs that build topical authority, rank for buyer-intent keywords, capture leads at a fraction of paid advertising costs, and compound in value every single month.
Comprehensive Digital Analytics & Reporting Framework
We built a comprehensive digital analytics and reporting framework for CoralReef Hospitality Group — transforming scattered, unreliable data into actionable intelligence that increased direct bookings by 64%, reduced marketing waste by $14,200/month, and gave leadership a single dashboard showing exactly which marketing efforts drive revenue.
Google Analytics 4, Google Tag Manager, Google Looker Studio, Google Search Console, Google Ads, Meta Ads Manager, Hotjar, Microsoft Clarity, Ahrefs, SEMrush, HubSpot CRM, Booking Engine API, Zapier, Make (Integromat), Google Sheets, BigQuery, ChatGPT API (OpenAI), Slack, WordPress
Project Year
2025
The Overview
CoralReef Hospitality Group operates 4 boutique resort properties across Goa, Kerala, Pondicherry, and Andaman — targeting premium domestic travelers and international tourists. With a combined digital marketing spend of $42,000/month across Google Ads, Meta Ads, SEO, content marketing, email campaigns, and influencer partnerships, they generated approximately 2,800 website visitors daily and 340 booking inquiries per month.
But here’s the painful truth: CoralReef had absolutely no idea which of those marketing efforts actually produced paying guests.
Their Google Analytics was misconfigured — tracking pageviews but missing 68% of conversion events. Their booking engine data lived in a separate system with no connection to marketing data. Ad platforms each claimed credit for the same bookings (double-counting). SEO performance was unmeasured. Content marketing ROI was unknown. Influencer partnerships were evaluated by Instagram likes, not actual bookings.
The marketing director described it as “spending $42,000 every month, hoping roughly half of it works, but having no way to know which half.”
We built a complete digital analytics and reporting ecosystem that tracks every visitor journey from first ad impression to confirmed booking, attributes revenue to the correct marketing channels, identifies optimization opportunities, and delivers automated intelligence reports — transforming CoralReef from data-blind to data-driven.
The Challenge
Broken Analytics Foundation: GA4 had been installed but was severely misconfigured:
68% of conversion events weren’t tracking (booking form submissions, phone calls, WhatsApp clicks, email inquiries)
Cross-domain tracking broken between main website and booking engine (different domains)
No e-commerce/revenue tracking configured
Internal traffic not filtered (staff visits inflating numbers)
UTM parameters used inconsistently across campaigns (some had them, most didn’t)
Result: Every number in GA4 was unreliable. Leadership didn’t trust any data.
Attribution Black Hole: Each ad platform reported conversions independently:
Google Ads claimed 180 bookings/month
Meta Ads claimed 145 bookings/month
But total actual bookings were only 220/month
The overlap was massive — both platforms took credit for the same customers
Nobody could answer: “If I cut Meta spend by $5,000, how many bookings would we actually lose?”
Disconnected Booking Data: The booking engine (separate SaaS platform) captured reservation data — room type, dates, revenue, guest details — but this data was completely disconnected from marketing analytics. It was impossible to know which Google Ad keyword led to a $12,000 luxury suite booking vs. which led to a $2,000 standard room inquiry.
Content & SEO Blindness: The team published 8-10 blog posts monthly and maintained 200+ pages of destination content — but had no visibility into which content drove traffic, which drove bookings, or what SEO opportunities were being missed.
Zero Behavioral Intelligence: No understanding of how users actually behaved on the website. Where did they drop off? What did they click? How did mobile users navigate differently? What stopped visitors from completing bookings? All unknown.
Manual, Unreliable Reporting: The marketing manager spent 12+ hours monthly compiling reports by manually exporting data from 6 platforms, copying into Excel, and creating charts. Reports were delivered 2 weeks after month-end. Numbers frequently didn’t match between reports, eroding leadership trust.
$42,000/Month with No ROI Clarity: The CEO wanted a simple answer: “For every dollar we spend on marketing, how much revenue do we get back?” Nobody could answer this question — not even approximately.
STEP 1: Visitor arrives on website → GA4 captures: source, medium, campaign, landing page → Client ID assigned and stored in cookie
STEP 2: Visitor clicks "Book Now" → redirected to booking engine → Cross-domain tracking preserves GA4 session → Client ID passed via URL parameter to booking engine
STEP 3: Booking completed on booking engine → Booking engine fires webhook with: • Booking ID • Room type • Check-in/out dates • Revenue amount • Guest email • Client ID (passed from website)
STEP 4: Webhook → Zapier → Multiple destinations: → GA4: Purchase event fired with revenue value → Google Ads: Conversion with value reported → Meta: Purchase event with value reported → HubSpot CRM: Deal created with source attribution → Google Sheets: Master booking log entry → BigQuery: Data warehouse record
RESULT: Every booking now has complete attribution: "This $8,400 booking came from a Google Ads search for 'luxury resort goa' → landed on Goa property page → browsed 3 room types → booked Presidential Suite for 4 nights → total revenue $8,400" ━━━━━━━━━━━━━━━━━━━━━━━━━━━━━━━━━━━━
Multi-Touch Attribution Model:
Replaced last-click attribution with a data-driven model:
Tracked average customer journey: 4.7 touchpoints across 12 days before booking
Typical journey example:
Touchpoint
Day
Channel
Attribution Weight
Instagram Reel (awareness)
Day 1
Meta Ads
12%
Google search “Goa luxury resorts” (research)
Day 4
Organic Search
18%
Blog read: “Top 10 Goa Beach Resorts” (education)
Day 4
Content/SEO
15%
Google Ads retargeting click (re-engagement)
Day 8
Google Ads
20%
Email: “Summer Special Offer” (nurture)
Day 10
Email Marketing
15%
Direct visit → Booking (conversion)
Day 12
Direct
20%
This revealed that Instagram Reels (previously considered “just branding”) were actually the #1 awareness driver contributing to 34% of all booking journeys — justifying increased investment.
Also revealed that Google Display Network ads ($4,800/month) appeared in less than 2% of booking journeys — leading to immediate budget reallocation.
AI-generated strategic analysis with budget reallocation recommendations
Intelligent Alert System:
Alert
Trigger
Notification
ROAS Drop
Any channel ROAS drops below 3× for 3 consecutive days
Slack: Marketing Director
Conversion Rate Drop
Website booking conversion drops 20%+ vs. 7-day avg
Slack: Marketing + Dev team
Budget Pacing
Any channel on track to overspend monthly budget by 10%+
Slack + Email: Marketing Director
Ranking Drop
Any top-20 keyword drops 5+ positions in a day
Slack: SEO team
Traffic Anomaly
Daily traffic 30%+ below or above normal
Slack: Marketing team (investigate)
Booking Spike
Daily bookings 50%+ above average
Slack: Celebration 🎉 + operations alert (prepare for influx)
Competitor Alert
Competitor launches new campaign on tracked keywords
Slack: Weekly competitive digest
Monthly AI Marketing Intelligence Briefing:
CORALREEF MARKETING INTELLIGENCE — MARCH 2025 ━━━━━━━━━━━━━━━━━━━━━━━━━━━━━━━━━━━━━━━━━━━━
📊 PERFORMANCE SUMMARY: STRONG (Score: 84/100)
REVENUE: $348,000 from 286 bookings (↑18% vs. Feb) MARKETING SPEND: $42,000 | BLENDED ROAS: 8.3× (↑ from 6.1×) COST PER BOOKING: $147 (↓22% vs. Feb)
TOP CHANNEL: Instagram Reels → 34% of booking journeys, ROAS 11.2× BIGGEST IMPROVEMENT: Organic search bookings ↑42% after content optimization BIGGEST CONCERN: Google Display ROAS 1.4× — recommend reducing budget 60%
KEY INSIGHTS: • "Luxury" keyword bookings average $4,200 vs. "budget" at $1,800 — shift paid targeting toward luxury intent • Kerala property blog content driving 3× more organic bookings than other properties — replicate content strategy for Goa • Email remarketing to past guests: ROAS 22× — most efficient channel; increase send frequency • Andaman property has 44% lower awareness — recommend dedicated brand campaign
Challenge: CoralReef Hospitality spent $42,000/month on marketing but couldn’t attribute 77% of bookings to any channel. GA4 was misconfigured, missing 68% of conversions. Booking engine data was disconnected from marketing analytics. Ad platforms double-counted conversions. Reports took 12+ hours to compile and arrived 2 weeks late. Nobody could answer: “Which marketing efforts actually generate bookings?”
Solution: We rebuilt GA4 with 32 GTM tags and 14 conversion events, bridged booking engine revenue to marketing attribution via webhooks, implemented multi-touch data-driven attribution, deployed behavioral analytics for conversion optimization, built 5 real-time dashboards, automated all reporting, and created an AI-powered monthly intelligence briefing with budget recommendations.
Result: Revenue attribution went from 23% to 94% visibility. Booking conversion rate improved 71%. Direct bookings increased 64%. $14,200/month in marketing waste identified and reallocated. ROAS improved from ~2.8× to 8.3×. Monthly reporting automated entirely. Estimated annual revenue impact: +$680,000.
Are You Spending Thousands on Marketing Without Knowing What Actually Works?
We build analytics and reporting systems that track every visitor journey, attribute every booking to the right channel, automate every report, and tell you exactly where to spend more and where to cut — so every marketing dollar works harder.