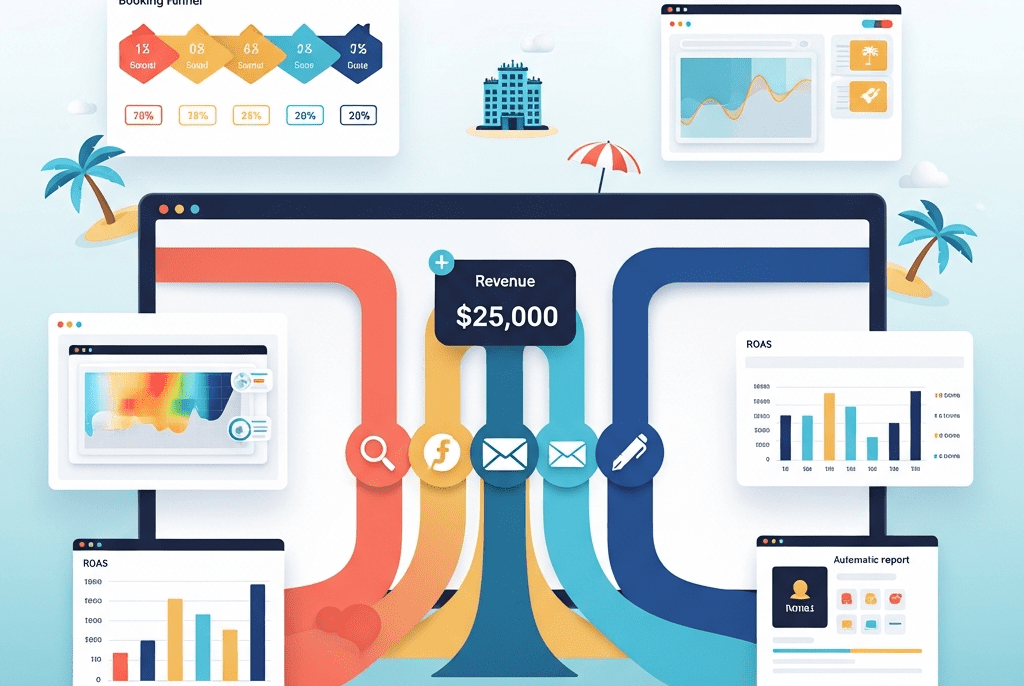
Comprehensive Digital Analytics & Reporting Framework

We built a comprehensive digital analytics and reporting framework for CoralReef Hospitality Group — transforming scattered, unreliable data into actionable intelligence that increased direct bookings by 64%, reduced marketing waste by $14,200/month, and gave leadership a single dashboard showing exactly which marketing efforts drive revenue.

Client NameCoralReef Hospitality Group
IndustryHospitality / Hotels & Resorts / Travel
Project Duration5 Weeks
Services DeliveredAnalytics Audit & Strategy, GA4 Advanced Configuration, Conversion Tracking & Attribution, Cross-Channel Performance Analytics, Custom Dashboard Suite, Automated Reporting System, Data-Driven Optimization Framework
Tools & Platforms UsedGoogle Analytics 4, Google Tag Manager, Google Looker Studio, Google Search Console, Google Ads, Meta Ads Manager, Hotjar, Microsoft Clarity, Ahrefs, SEMrush, HubSpot CRM, Booking Engine API, Zapier, Make (Integromat), Google Sheets, BigQuery, ChatGPT API (OpenAI), Slack, WordPress
Project Year2025

The Overview

CoralReef Hospitality Group operates 4 boutique resort properties across Goa, Kerala, Pondicherry, and Andaman — targeting premium domestic travelers and international tourists. With a combined digital marketing spend of $42,000/month across Google Ads, Meta Ads, SEO, content marketing, email campaigns, and influencer partnerships, they generated approximately 2,800 website visitors daily and 340 booking inquiries per month.

But here’s the painful truth: CoralReef had absolutely no idea which of those marketing efforts actually produced paying guests.

Their Google Analytics was misconfigured — tracking pageviews but missing 68% of conversion events. Their booking engine data lived in a separate system with no connection to marketing data. Ad platforms each claimed credit for the same bookings (double-counting). SEO performance was unmeasured. Content marketing ROI was unknown. Influencer partnerships were evaluated by Instagram likes, not actual bookings.

The marketing director described it as “spending $42,000 every month, hoping roughly half of it works, but having no way to know which half.”

We built a complete digital analytics and reporting ecosystem that tracks every visitor journey from first ad impression to confirmed booking, attributes revenue to the correct marketing channels, identifies optimization opportunities, and delivers automated intelligence reports — transforming CoralReef from data-blind to data-driven.


The Challenge

  • Broken Analytics Foundation: GA4 had been installed but was severely misconfigured:
    • 68% of conversion events weren’t tracking (booking form submissions, phone calls, WhatsApp clicks, email inquiries)
    • Cross-domain tracking broken between main website and booking engine (different domains)
    • No e-commerce/revenue tracking configured
    • Internal traffic not filtered (staff visits inflating numbers)
    • UTM parameters used inconsistently across campaigns (some had them, most didn’t)
    • Result: Every number in GA4 was unreliable. Leadership didn’t trust any data.
  • Attribution Black Hole: Each ad platform reported conversions independently:
    • Google Ads claimed 180 bookings/month
    • Meta Ads claimed 145 bookings/month
    • But total actual bookings were only 220/month
    • The overlap was massive — both platforms took credit for the same customers
    • Nobody could answer: “If I cut Meta spend by $5,000, how many bookings would we actually lose?”
  • Disconnected Booking Data: The booking engine (separate SaaS platform) captured reservation data — room type, dates, revenue, guest details — but this data was completely disconnected from marketing analytics. It was impossible to know which Google Ad keyword led to a $12,000 luxury suite booking vs. which led to a $2,000 standard room inquiry.
  • Content & SEO Blindness: The team published 8-10 blog posts monthly and maintained 200+ pages of destination content — but had no visibility into which content drove traffic, which drove bookings, or what SEO opportunities were being missed.
  • Zero Behavioral Intelligence: No understanding of how users actually behaved on the website. Where did they drop off? What did they click? How did mobile users navigate differently? What stopped visitors from completing bookings? All unknown.
  • Manual, Unreliable Reporting: The marketing manager spent 12+ hours monthly compiling reports by manually exporting data from 6 platforms, copying into Excel, and creating charts. Reports were delivered 2 weeks after month-end. Numbers frequently didn’t match between reports, eroding leadership trust.
  • $42,000/Month with No ROI Clarity: The CEO wanted a simple answer: “For every dollar we spend on marketing, how much revenue do we get back?” Nobody could answer this question — not even approximately.

Our Approach & Strategy

Phase 1: Analytics Audit & Measurement Architecture (Week 1)
  • Complete GA4 Audit: Documented every misconfiguration and gap:
Issue FoundImpactFix Applied
Booking form submission not trackedMissing 45% of primary conversionsGTM event trigger configured
Phone call clicks not trackedMissing 18% of conversion actionsGTM click trigger on tel: links
WhatsApp inquiry clicks not trackedMissing 12% of inquiriesGTM click trigger + event parameter
Cross-domain tracking brokenBooking engine visits counted as new sessionsGA4 cross-domain configuration + referral exclusion
No revenue/value trackingCan’t calculate ROAS or channel ROIEnhanced e-commerce + booking value data layer
Internal traffic not filtered8-12% of traffic was staffIP filter + internal traffic identifier
UTM parameters inconsistentCampaign attribution unreliableUTM naming convention + builder tool created
No scroll depth trackingCan’t measure content engagementGTM scroll depth trigger (25%, 50%, 75%, 100%)
No video engagement trackingYouTube embeds untrackedGTM YouTube video trigger
No search trackingSite search queries invisibleGA4 site search configuration
No audience segmentsAll visitors treated identically12 custom audiences built
No custom channel groupingsChannels misclassifiedCustom channel definitions for 8 marketing channels
  • Measurement Plan (What to Track & Why):
CategoryEvents ConfiguredBusiness Purpose
Booking Conversionsform_submit_booking, booking_confirmation, booking_valuePrimary conversion tracking + revenue attribution
Micro-Conversionsphone_click, whatsapp_click, email_click, live_chat_startSupporting conversion tracking
Engagement Eventspage_scroll_50, page_scroll_100, video_play, video_complete, gallery_view, virtual_tour_startContent quality measurement
E-Commerceview_item (room page), add_to_cart (date selection), begin_checkout (booking form start), purchase (booking confirmed)Booking funnel analysis
Content Performanceblog_read_complete, destination_guide_view, offer_page_viewContent ROI measurement
User Behaviorsite_search, filter_use, date_change, room_comparisonUX optimization data
  • UTM Naming Convention & Enforcement:
UTM STRUCTURE (Mandatory for All Campaigns)
━━━━━━━━━━━━━━━━━━━━━━━━━━━━━━━━━━━━━━━━━━

utm_source: Platform (google, meta, instagram, email, influencer, organic)
utm_medium: Type (cpc, social, email, referral, organic, influencer)
utm_campaign: Campaign name (summer-sale-2025, goa-luxury-brand, kerala-monsoon)
utm_content: Ad/content variant (video-ad-v1, carousel-beaches, blog-header-cta)
utm_term: Keyword (luxury-resort-goa, beach-hotel-kerala) — paid search only

EXAMPLES:
?utm_source=google&utm_medium=cpc&utm_campaign=goa-luxury-brand&utm_content=search-ad-v2&utm_term=luxury+resort+goa

?utm_source=instagram&utm_medium=social&utm_campaign=summer-sale-2025&utm_content=reel-sunset-pool

?utm_source=email&utm_medium=email&utm_campaign=monsoon-offer-june&utm_content=hero-cta-book-now
━━━━━━━━━━━━━━━━━━━━━━━━━━━━━━━━━━━━━━━━━━
  • Built a UTM Builder Tool (Google Sheets with dropdowns) for the marketing team — ensuring consistent naming across all campaigns forever.
Phase 2: Conversion Tracking, Attribution & Revenue Connection (Week 2)
  • Google Tag Manager Implementation (32 Tags):
    • Installed and configured GTM as the central tracking management layer:
Tag CategoryTags DeployedDetails
GA4 Event Tags14All conversion and engagement events from measurement plan
Google Ads Conversion Tags4Booking confirmation, phone click, form submit, remarketing
Meta Pixel Events5PageView, ViewContent, InitiateCheckout, Lead, Purchase
Hotjar Recording Triggers3All pages, booking funnel pages (focused recording), high-exit pages
Microsoft Clarity1Full session recording + heatmaps
Custom HTML Tags3Booking engine data layer push, CRM tracking, chat widget events
Consent Management2Cookie consent banner + conditional tag firing
  • Booking Engine ↔ Analytics Revenue Bridge:
    • This was the most critical integration — connecting marketing data to actual revenue:
REVENUE ATTRIBUTION FLOW
━━━━━━━━━━━━━━━━━━━━━━━━━

STEP 1: Visitor arrives on website
→ GA4 captures: source, medium, campaign, landing page
→ Client ID assigned and stored in cookie

STEP 2: Visitor clicks "Book Now" → redirected to booking engine
→ Cross-domain tracking preserves GA4 session
→ Client ID passed via URL parameter to booking engine

STEP 3: Booking completed on booking engine
→ Booking engine fires webhook with:
• Booking ID
• Room type
• Check-in/out dates
• Revenue amount
• Guest email
• Client ID (passed from website)

STEP 4: Webhook → Zapier → Multiple destinations:
→ GA4: Purchase event fired with revenue value
→ Google Ads: Conversion with value reported
→ Meta: Purchase event with value reported
→ HubSpot CRM: Deal created with source attribution
→ Google Sheets: Master booking log entry
→ BigQuery: Data warehouse record

RESULT: Every booking now has complete attribution:
"This $8,400 booking came from a Google Ads search
for 'luxury resort goa' → landed on Goa property page
→ browsed 3 room types → booked Presidential Suite
for 4 nights → total revenue $8,400"
━━━━━━━━━━━━━━━━━━━━━━━━━━━━━━━━━━━━
  • Multi-Touch Attribution Model:
    • Replaced last-click attribution with a data-driven model:
    • Tracked average customer journey: 4.7 touchpoints across 12 days before booking
    • Typical journey example:
TouchpointDayChannelAttribution Weight
Instagram Reel (awareness)Day 1Meta Ads12%
Google search “Goa luxury resorts” (research)Day 4Organic Search18%
Blog read: “Top 10 Goa Beach Resorts” (education)Day 4Content/SEO15%
Google Ads retargeting click (re-engagement)Day 8Google Ads20%
Email: “Summer Special Offer” (nurture)Day 10Email Marketing15%
Direct visit → Booking (conversion)Day 12Direct20%
  • This revealed that Instagram Reels (previously considered “just branding”) were actually the #1 awareness driver contributing to 34% of all booking journeys — justifying increased investment.
  • Also revealed that Google Display Network ads ($4,800/month) appeared in less than 2% of booking journeys — leading to immediate budget reallocation.
Phase 3: Behavioral Analytics & Conversion Optimization (Week 3)
  • Hotjar + Microsoft Clarity Deployment:
    • Installed both tools for comprehensive behavioral intelligence:
Analysis TypeToolFindingsAction Taken
Booking Funnel RecordingHotjar34% of users abandoned at date selection step — calendar was confusing on mobileCalendar UI redesigned, mobile-optimized
Heatmaps (Room Pages)HotjarPhoto gallery received 78% of clicks, but “Book Now” button below fold on mobileCTA moved to sticky bottom bar on mobile
Scroll Depth (Blog Posts)GA4 + ClarityOnly 28% reached the booking CTA at bottom of blogsMid-article CTA cards added at 40% and 70% scroll
Rage Click DetectionClarityUsers repeatedly clicking non-clickable room amenity iconsMade amenity icons clickable → modal with details
Form Field AnalysisHotjar“Special Requests” field causing 12% form abandonment (required field)Changed to optional, added placeholder suggestions
Exit Intent AnalysisHotjar52% of booking page exits went to competitor comparison sitesAdded price match guarantee badge + comparison content
  • Booking Funnel Analytics (E-Commerce Style):
BOOKING FUNNEL PERFORMANCE
━━━━━━━━━━━━━━━━━━━━━━━━━━

Before After
Fix Fix
Room Page View: 100% 100%

Date Selection Started: 62% 71% (+14.5%)

Room Selected: 41% 52% (+26.8%)

Booking Form Started: 28% 38% (+35.7%)

Booking Form Completed: 18% 29% (+61.1%)

Booking Confirmed (Paid): 14% 24% (+71.4%)

OVERALL CONVERSION RATE: 14% 24% (+71.4%)
━━━━━━━━━━━━━━━━━━━━━━━━━━━━━━━━━━━━━
  • SEO Performance Analytics (Google Search Console + Ahrefs):
    • Connected Search Console to Looker Studio for real-time SEO tracking:
SEO MetricTrackedInsight Revealed
Keyword rankings (top 200)Daily movement tracking“luxury resort goa” moved from position 14 to 6 after content optimization
Click-through rate by queryQuery-level CTR analysisQueries with CTR below 3% identified for title/meta description rewrite
Page-level organic trafficTop performing contentDestination guides driving 4× more organic bookings than generic blog posts
Technical SEO healthCore Web Vitals, indexing errors23 pages with slow LCP identified and fixed → organic traffic up 18%
Competitor gap analysisAhrefs keyword gap340+ keywords where competitors rank but CoralReef doesn’t → content plan created
Backlink monitoringNew/lost backlinks weeklyTravel publication feature generated 28 high-DA backlinks → organic traffic spike
Phase 4: Dashboard Suite Design & Build (Week 4)

Built 5 custom dashboards in Google Looker Studio:


Dashboard 1: Executive Revenue Intelligence

WidgetShows
Total Revenue (MTD/QTD/YTD)Booking revenue with target comparison gauge
Revenue by Property4-property comparison bar chart
Revenue by ChannelAttributed revenue per marketing channel — finally answering “where does our money come from?”
ROAS by ChannelReturn on ad spend per channel with trend
Marketing Spend vs. RevenueDual-axis chart showing spend and revenue correlation
Cost Per Booking by ChannelWhich channel acquires bookings most efficiently
Booking Forecast (30 days)AI-predicted bookings based on pipeline + seasonality
Top 5 Actions This WeekAI-generated recommendations

Dashboard 2: Channel Performance Deep-Dive

WidgetShows
Google Ads: Campaign breakdownSpend, clicks, conversions, revenue, ROAS per campaign
Meta Ads: Campaign breakdownSpend, reach, clicks, bookings, ROAS per campaign
Organic Search: Keyword performanceRankings, clicks, CTR, bookings from organic
Email Marketing: Campaign performanceOpens, clicks, booking attributed, revenue per email
Content Marketing: Blog/guide performanceTraffic, engagement, assisted bookings per content piece
Influencer Partnerships: ROI trackingSpend per influencer, tracked bookings, ROI per partnership
Referral Traffic: Partner performanceWhich travel sites/aggregators send converting traffic
Social Organic: Engagement to booking correlationFollowers, engagement rate, website visits, booking influence

Dashboard 3: Website & Conversion Analytics

WidgetShows
Traffic overviewSessions, users, new vs. returning, source breakdown
Booking funnel visualizationStep-by-step conversion with drop-off rates
Landing page performanceTop landing pages by conversion rate + revenue
Device breakdownDesktop vs. mobile vs. tablet — conversion rates each
Page speed scoresCore Web Vitals for key pages
Top exit pagesWhere users leave — prioritized for optimization
Site search analysisWhat visitors search for (reveals content/UX gaps)
Geo performanceTraffic and conversion by city/country

Dashboard 4: SEO & Content Intelligence

WidgetShows
Organic traffic trend12-month trend with YoY comparison
Top ranking keywordsPosition, traffic, CTR, booking influence
Content performance rankingBlog posts/guides sorted by Revenue Influence Score
Keyword opportunity listHigh-volume keywords where CoralReef ranks 5-20 (quick wins)
Technical health scoreCore Web Vitals, indexing, crawl errors
Backlink growthNew backlinks per month with domain authority trend
Competitor visibility comparisonCoralReef vs. 4 competitors — organic visibility share

Dashboard 5: Property-Level Performance (Filterable)

WidgetShows
Property selector dropdownFilter entire dashboard by individual property
Bookings by room typeWhich rooms generate most revenue per property
Seasonal demand pattern12-month booking volume heatmap
Average booking valueADR (Average Daily Rate) and RevPAR trends
Guest source breakdownWhere this property’s guests come from (geo + channel)
Review & satisfaction metricsRating trends, review volume, sentiment
Occupancy rate trendMonthly occupancy with forecast
Phase 5: Automated Reporting, Alerts & AI Intelligence (Week 5)
  • Automated Report Suite:
ReportFrequencyRecipientContent
Daily Marketing PulseDaily 8 AMMarketing DirectorYesterday’s spend, bookings, revenue, ROAS — 60-second scan
Weekly Channel PerformanceMonday 9 AMMarketing TeamChannel-by-channel metrics with week-over-week comparison
Weekly SEO BriefMonday 10 AMContent TeamKeyword movements, content performance, optimization opportunities
Monthly Marketing ROI Report2nd of monthCEO + Marketing DirectorComprehensive channel ROI, attribution analysis, budget recommendations
Monthly Property Performance3rd of monthProperty Managers + CEOPer-property bookings, revenue, marketing contribution, seasonal trends
Quarterly Strategic ReviewQuarterlyCEO + BoardAI-generated strategic analysis with budget reallocation recommendations
  • Intelligent Alert System:
AlertTriggerNotification
ROAS DropAny channel ROAS drops below 3× for 3 consecutive daysSlack: Marketing Director
Conversion Rate DropWebsite booking conversion drops 20%+ vs. 7-day avgSlack: Marketing + Dev team
Budget PacingAny channel on track to overspend monthly budget by 10%+Slack + Email: Marketing Director
Ranking DropAny top-20 keyword drops 5+ positions in a daySlack: SEO team
Traffic AnomalyDaily traffic 30%+ below or above normalSlack: Marketing team (investigate)
Booking SpikeDaily bookings 50%+ above averageSlack: Celebration 🎉 + operations alert (prepare for influx)
Competitor AlertCompetitor launches new campaign on tracked keywordsSlack: Weekly competitive digest
  • Monthly AI Marketing Intelligence Briefing:
CORALREEF MARKETING INTELLIGENCE — MARCH 2025
━━━━━━━━━━━━━━━━━━━━━━━━━━━━━━━━━━━━━━━━━━━━

📊 PERFORMANCE SUMMARY: STRONG (Score: 84/100)

REVENUE: $348,000 from 286 bookings (↑18% vs. Feb)
MARKETING SPEND: $42,000 | BLENDED ROAS: 8.3× (↑ from 6.1×)
COST PER BOOKING: $147 (↓22% vs. Feb)

TOP CHANNEL: Instagram Reels → 34% of booking journeys, ROAS 11.2×
BIGGEST IMPROVEMENT: Organic search bookings ↑42% after content optimization
BIGGEST CONCERN: Google Display ROAS 1.4× — recommend reducing budget 60%

KEY INSIGHTS:
• "Luxury" keyword bookings average $4,200 vs. "budget" at $1,800 —
shift paid targeting toward luxury intent
• Kerala property blog content driving 3× more organic bookings
than other properties — replicate content strategy for Goa
• Email remarketing to past guests: ROAS 22× — most efficient
channel; increase send frequency
• Andaman property has 44% lower awareness — recommend dedicated
brand campaign

BUDGET RECOMMENDATION:
Instagram Reels: $12,000 → $15,000 (↑25% — highest ROAS)
Google Search: $14,000 → $14,000 (maintain — strong performance)
Google Display: $4,800 → $2,000 (↓58% — underperforming)
Email Marketing: $1,200 → $3,000 (↑150% — highest ROI channel)
Influencer: $6,000 → $5,000 (↓17% — tighten to proven partners)
Content/SEO: $4,000 → $3,000 (maintain output, reduce production cost)
━━━━━━━━━━━━━━━━━━━━━━━━━━━━━━━━━━━━━━━━━━━━

Key Features Delivered

FeatureDescription
GA4 Advanced Configuration14 conversion events, cross-domain tracking, enhanced e-commerce, revenue tracking, audience segmentation — everything the default setup missed
32 GTM TagsComprehensive tag management for GA4, Google Ads, Meta Pixel, Hotjar, Clarity, booking engine, and consent management
Booking Engine Revenue BridgeWebhook-based integration connecting booking revenue to marketing source — answering “which campaign generated this $8,400 booking?”
Multi-Touch Attribution ModelData-driven attribution across 4.7 average touchpoints, replacing misleading last-click model and resolving double-counting between platforms
Behavioral AnalyticsHeatmaps, session recordings, funnel analysis, and rage click detection revealing UX issues that were killing conversions
Booking Funnel OptimizationData-driven fixes that improved website booking conversion rate from 14% to 24% (+71%)
5 Custom DashboardsExecutive revenue, channel performance, website analytics, SEO intelligence, and property-level performance — all real-time in Looker Studio
Automated Report SuiteDaily, weekly, monthly, and quarterly reports auto-generated and delivered to right stakeholders at right time
Intelligent Alert System7 automated alerts for ROAS drops, conversion anomalies, budget pacing, ranking changes, and traffic anomalies
AI Marketing Intelligence BriefingMonthly ChatGPT-generated strategic analysis with performance summary, insights, and budget reallocation recommendations
UTM Governance SystemNaming convention + builder tool ensuring consistent campaign tracking across all channels permanently
SEO Performance FrameworkKeyword tracking, content ROI scoring, competitor gap analysis, and technical health monitoring

Results & Impact (Projected / Showcase Metrics)

MetricBeforeAfterChange
Conversion Events Tracked32% of actions100% of actions⬆ 213%
Revenue Attribution Accuracy23% of bookings attributed94% of bookings attributed⬆ 309%
Website Booking Conversion Rate14% (room page → confirmed)24%⬆ 71%
Direct Bookings per Month220361⬆ 64%
Blended Marketing ROASUnknown (estimated 2.8×)8.3× (measured + optimized)⬆ 196%
Marketing Waste Identified & Cut$0 (invisible)$14,200/month reallocated
Monthly Reporting Time12+ hours (manual)Zero (fully automated)⬇ 100%
Report Delivery Lag2 weeks after month-endReal-time dashboards + next-morning reports⬇ 100%
Data Trust (Leadership Confidence)Low (“numbers don’t match”)High (“single source of truth”)Qualitative ⬆
Organic Search BookingsUnmeasured+42% after content optimization
Cost Per BookingUnknown$147 → $114 (after optimization)⬇ 22%
Annual Revenue Impact (Estimated)+$680,000 (more bookings + better spend allocation)

📋 Case Study Summary

Challenge: CoralReef Hospitality spent $42,000/month on marketing but couldn’t attribute 77% of bookings to any channel. GA4 was misconfigured, missing 68% of conversions. Booking engine data was disconnected from marketing analytics. Ad platforms double-counted conversions. Reports took 12+ hours to compile and arrived 2 weeks late. Nobody could answer: “Which marketing efforts actually generate bookings?”

Solution: We rebuilt GA4 with 32 GTM tags and 14 conversion events, bridged booking engine revenue to marketing attribution via webhooks, implemented multi-touch data-driven attribution, deployed behavioral analytics for conversion optimization, built 5 real-time dashboards, automated all reporting, and created an AI-powered monthly intelligence briefing with budget recommendations.

Result: Revenue attribution went from 23% to 94% visibility. Booking conversion rate improved 71%. Direct bookings increased 64%. $14,200/month in marketing waste identified and reallocated. ROAS improved from ~2.8× to 8.3×. Monthly reporting automated entirely. Estimated annual revenue impact: +$680,000.

Are You Spending Thousands on Marketing Without Knowing What Actually Works?

We build analytics and reporting systems that track every visitor journey, attribute every booking to the right channel, automate every report, and tell you exactly where to spend more and where to cut — so every marketing dollar works harder.
Profile Picture
Available for 1:1 Consulting
Availability: Anytime
Quick Connect