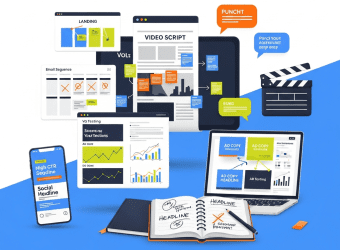
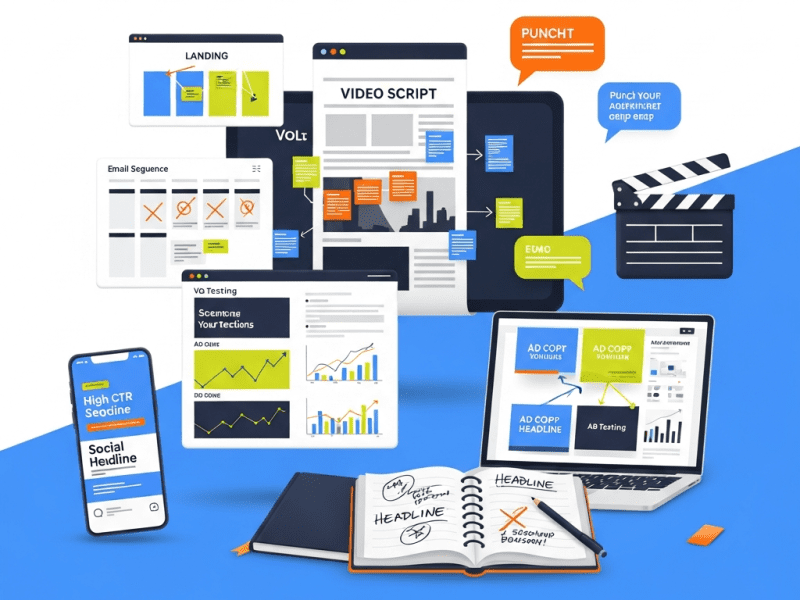
We built a complete ad copywriting and script system for VoltEdge EV — producing 200+ conversion-optimized copy assets across video scripts, ad copy, landing pages, and email sequences, increasing ad CTR by 186%, lifting landing page conversion rate by 142%, and giving the brand a distinctive voice that turns EV skeptics into buyers.
Brand Messaging Architecture, Ad Copy Framework & Tone System, Video Script Library (Short-Form + Long-Form), Sales Page & Landing Page Copy, Email Sequence Copywriting, Social Media Caption Framework, A/B Testing Copy Variants, Objection-Handling Copy Bank, Competitor Messaging Analysis, Copy Style Guide & Team Training
Tools & Platforms Used
Google Docs, Notion, Airtable, ChatGPT API (OpenAI), Jasper AI, Hemingway Editor, Grammarly, Canva Pro (ad mockups), CapCut Pro (video script storyboarding), Google Sheets (A/B test tracking), Meta Ads Manager (ad copy deployment), YouTube (script deployment), Slack, Loom, Google Analytics 4, Hotjar (landing page copy testing)
Project Year
2025
The Overview
VoltEdge EV is an electric vehicle startup selling two products — a high-performance electric scooter (VoltEdge Bolt, ₹1,15,000) and an urban commuter e-scooter (VoltEdge Glide, ₹78,000). Their scooters are genuinely impressive — 120km true range, 0-40 kmph in 3.2 seconds, swappable batteries, IoT-connected dashboard, and a 5-year/50,000km warranty. In independent testing, VoltEdge outperformed Ather, Ola, and TVS iQube on range, build quality, and after-sales service.
But their marketing copy was killing them.
Their ads read like engineering spec sheets: “150Nm torque, 3.7kWh lithium-ion battery, IP67 rated motor, BLDC hub motor architecture.” Their landing page was a feature dump — 47 bullet points of technical specifications with zero emotional resonance. Their video scripts were product demos narrated in a monotone by a founder who, brilliant as he was, spoke to the camera like he was presenting at an engineering conference.
The EV market in India is an emotional purchase disguised as a rational one. Customers say they buy EVs for fuel savings and environment — but they actually buy for status, innovation identity, the thrill of silent acceleration, and the feeling of being “ahead of the curve.” Ather understood this — their “Made in Madras” campaign sold identity, not specs. VoltEdge was selling specs to an audience buying feelings.
We built a complete ad copywriting and script system — from brand messaging architecture and voice framework to video scripts, ad copy variants, landing page copy, email sequences, and an objection-handling copy bank — giving VoltEdge words that sell, not just inform.
The Challenge
Engineering-First Copy, Zero Emotional Resonance: Every piece of copy read like a technical whitepaper. The founder wrote most copy himself — a brilliant engineer with zero marketing training. Headlines like “Advanced BLDC Motor with Regenerative Braking” replaced what should have been “The Smoothest Ride You’ve Never Heard Coming.”
Abysmal Ad Performance Due to Copy:
Metric
VoltEdge (Before)
Industry Benchmark (EV/Auto)
Gap
Ad CTR (Meta)
0.7%
1.8%–2.5%
61–72% below
Landing Page Conversion Rate
1.4%
3.0%–4.5%
53–69% below
Video Watch-Through Rate
18%
40%–55%
55–67% below
Email Open Rate
12%
22%–28%
46–57% below
Email Click Rate
0.8%
3.0%–4.5%
73–82% below
No Objection Handling: The #1 reason EV prospects don’t convert: range anxiety, charging infrastructure fear, battery replacement cost uncertainty, and resale value doubt. VoltEdge’s copy addressed none of these. No FAQ content, no comparison content, no myth-busting, no social proof addressing specific fears.
Competitor Messaging Superiority:
Competitor
Messaging Approach
Why It Works
Ather Energy
Identity + Community — “Join the revolution,” “Made in Madras”
Sells belonging and pride, not just a scooter
Ola Electric
Aspiration + Future — “Move OS,” “The future is here”
Positions as tech product, not just vehicle
TVS iQube
Trust + Heritage — “From the house of TVS,” practical benefits
No Brand Voice: No documented tone, personality, or messaging framework. Copy varied wildly — formal engineering language in ads, casual slang in social posts, corporate jargon on the website. The brand sounded like three different companies.
“120km real range. 5-year warranty. 1,200+ riders who switched and never looked back.”
Compare / Learn More / See Reviews
Decision
“I’m almost ready — need a final push”
Overcome last objections, create urgency
“The math: ₹0.15/km vs. ₹4.50/km. Over 5 years, that’s ₹3.2 lakh saved. Enough for a vacation every year.”
Book Test Ride / Reserve Yours / Buy Now
Post-Purchase
“Did I make the right choice?”
Validate, build advocacy
“Welcome to the 1,200+ riders who outride everything. Your adventure starts now.”
Share Your Ride / Refer a Friend
Phase 2: Ad Copy System — Multi-Platform (Week 2)
Ad Copy Framework — 5 Angles × 3 Variants:
Copy Angle
Emotional Trigger
Headline Example
Body Copy Example
Best For
💰 Savings
Financial relief, “I’m smarter than petrol riders”
“Your petrol bill last month? ₹3,200. Ours? ₹180.”
“The average Bangalorean spends ₹3,200/month on petrol for a 30km daily commute. VoltEdge Bolt owners spend ₹180. That’s ₹36,000 saved every year — and we haven’t even talked about zero maintenance, zero oil changes, and zero engine servicing.”
MOFU/BOFU — rational buyers, budget-conscious
⚡ Performance
Thrill, status, “this is exciting tech”
“0 to 40 in 3.2 seconds. And you won’t hear it coming.”
“150Nm of instant torque. No gear shifts. No engine lag. Just twist and go — silent, smooth, absurdly fast. The traffic light turns green and you’re already three cars ahead before anyone else moves.”
TOFU/MOFU — performance seekers, young professionals
😰 Objection Killer
Relief from fear, “my concerns are addressed”
“Worried about range? We were too. So we tested in Bangalore traffic, not a lab.”
“120km real-world range. Tested in Bangalore traffic — with potholes, signals, and that one stretch where you always get stuck for 20 minutes. Not ‘up to 120km under ideal conditions.’ Actual, everyday, your-commute range.”
MOFU/BOFU — skeptical researchers
🌍 Identity
Pride, belonging, future-forward identity
“You’re not just buying a scooter. You’re voting for the future.”
“Every time you ride a VoltEdge, you save 1.2kg of CO2 emissions. Over a year, that’s 438kg — the equivalent of planting 20 trees. Plus, you look ridiculously cool while doing it.”
TOFU — values-driven, socially conscious
📣 Social Proof
Trust, FOMO, “others like me chose this”
“1,200+ riders switched. Here’s why none of them switched back.”
“Rahul in Koramangala switched 8 months ago. His fuel savings? ₹28,800 and counting. His service visits? Zero. His only complaint? ‘I should have switched sooner.’ Join 1,200+ riders who outride everything.”
MOFU/BOFU — trust-seeking, undecided
Each angle produced in 3 variants (A/B/C) for testing = 15 core ad copy sets
Each set adapted for: Meta Feed, Meta Stories, YouTube pre-roll, Google Search, Display = 75 total ad copy pieces
VOLTEDGE — "THE MORNING AFTER" (60 SEC)
━━━━━━━━━━━━━━━━━━━━━━━━━━━━━━━━━━━━━━━

[0-5s] COLD OPEN — VISUAL HOOK
Visual: Close-up of a petrol pump meter spinning rapidly — ₹50... ₹100... ₹200... ₹350...
Audio: Petrol pump clicking sounds, increasing in speed
Text on screen: None

[5-10s] THE PAIN
Visual: Rider's face watching the meter, slight wince at ₹350
VO: "₹350. Again. For a week's commute."
Visual: Cut to traffic jam — exhaust fumes, engine noise, heat shimmer

[10-20s] THE SHIFT
Visual: Morning. Same rider walks to their VoltEdge Bolt in parking.
Silence. They twist the throttle.
VO: "What if tomorrow morning felt... different?"
Visual: Smooth, silent ride through Bangalore streets. No engine roar.
Wind. Trees. Space.
Audio: Ambient city sounds — birds, distant traffic — but no engine noise

[20-35s] THE EXPERIENCE
Visual: Quick cuts — weaving through traffic effortlessly, pulling
ahead at traffic light (0-40 in 3.2s), gliding past a petrol station
(rider glances, smiles), arriving at office with 92km range remaining
VO: "120 kilometers of range. ₹0.15 per kilometer. Zero noise.
Zero emissions. And that feeling — that silent, instant, grin-inducing
feeling — of leaving everything behind."

[35-50s] THE PROOF
Visual: Split screen — ₹0.15/km vs. ₹4.50/km. 5-year warranty badge.
4.8★ review score. Riders montage — diverse people, diverse cities.
VO: "1,200 riders switched. Their fuel savings? ₹36,000 a year.
Their service bills? Almost zero. Their only regret?"

[50-55s] TESTIMONIAL PUNCH
Visual: Real customer (Rahul, 32), casual, direct to camera
Customer: "I should have done this two years ago."

[55-60s] CLOSE
Visual: VoltEdge Bolt — hero shot, golden hour lighting
Text: "VoltEdge Bolt. From ₹1,15,000."
VO: "Outride Everything."
Text: "Book your test ride → voltedge.in"
━━━━━━━━━━━━━━━━━━━━━━━━━━━━━━━━━━━━━━━━━━━━━━━━━━━━
[0-3s] HOOK Text on screen: "But what about range? 🤔" VO: "Everyone asks this."
[3-10s] ACKNOWLEDGE + DESTROY Visual: Map of Bangalore with 120km route highlighted — home → office → gym → grocery → home → still 40km remaining VO: "120 kilometers. That's home to office and back — for three days — on a single charge."
[10-17s] PROOF Visual: Dashboard showing real range after full day of riding: 68km remaining VO: "And that's in real Bangalore traffic. We tested. We're obsessed."
[17-20s] CTA Visual: VoltEdge Bolt, charging at home (regular plug) Text: "Charges at any plug point. Like your phone." Text: "Book a test ride → voltedge.in" ━━━━━━━━━━━━━━━━━━━━━━━━━━━━━━━━━━━━━━━━━━━━━━━━━━━━
Email Sequence Copy — Test Ride Nurture (7 Emails):
Email #
Timing
Subject Line
Purpose
Copy Angle
1
Immediate (post-test ride booking)
“Your test ride is confirmed 🛵⚡”
Confirm + excite
Logistics + what to expect + “You’re about to feel something different”
2
Day 1 post-test ride
“So… how was the silence? 😏”
Capture emotion while fresh
Reinforce the feeling, not the specs — “That grin at the traffic light? That’s what 150Nm feels like”
3
Day 3
“Let’s talk money (you’re going to like this)”
Financial case
Personalized savings calculation based on their commute input, comparison to petrol cost
4
Day 5
“Your biggest worry — answered”
Objection handling
Address top 3 fears: range, charging, battery — with data and real customer quotes
5
Day 8
“Rahul saved ₹28,800 in 8 months”
Social proof story
Full customer story — relatable, specific, with photo and quote
6
Day 12
“This week only: ₹5,000 off + free accessories”
Offer + urgency
Time-limited incentive to convert fence-sitters — create genuine urgency
7
Day 18
“No pressure. But your petrol bill just went up again.”
Gentle nudge + value reminder
Soft, no-hard-sell — “Whenever you’re ready, we’re here. But every month of waiting costs you ₹3,200.”
Objection-Handling Copy Bank (12 Objections):
Objection
Short-Form (Social/Ad)
Medium-Form (FAQ/Email)
“120km isn’t enough range”
“The average Indian commute is 22km/day. 120km = 5 days without charging. When’s the last time your petrol lasted that long?”
“We get it — range anxiety is real. So let’s do the math: The average daily commute in Bangalore is 22km. VoltEdge Bolt’s 120km range means you charge once every 5 working days. Even with a grocery run and weekend ride, you’re charging twice a week. At home. While you sleep. With any plug point. Range anxiety solved.”
“Where do I charge?”
“Anywhere there’s a plug. Your home. Your office. Your friend’s house. Charges to 80% in 4 hours.”
“Unlike cars, electric scooters don’t need special charging stations. Plug into any regular 5A socket — at home, at office, at a café. Full charge in 5 hours, 80% in 4. Most VoltEdge riders charge overnight and never think about it again. It’s literally easier than going to a petrol pump.”
“Battery replacement is expensive”
“5-year warranty covers the battery. But in case you’re wondering — our batteries retain 80% capacity after 1,50,000 km.”
“VoltEdge batteries are rated for 1,500+ charge cycles — that’s over 1,50,000 km of riding. After 1,500 cycles, they still retain 80%+ capacity. And our 5-year/50,000km warranty covers the battery. For context, most riders replace their petrol scooter after 5-7 years. Your VoltEdge battery will outlast your desire to ride the same scooter.”
“EVs have no resale value”
“Fun fact: Used EVs now sell at 65-70% of purchase price after 2 years. Used petrol scooters? 45-50%. Numbers don’t lie.”
“The resale market for EVs is growing faster than any vehicle segment. VoltEdge owners who’ve sold after 2 years report resale values of 65-70% of purchase price — significantly better than petrol scooters (45-50%). As charging infrastructure grows and petrol prices rise, EV resale value only improves.”
Hook (unexpected angle on feature) → Benefit translation → Proof point → CTA
60-100 words
“Your scooter has a clutch, gears, oil, filters, belts, spark plugs, and 200+ moving parts that can break. VoltEdge Bolt has 3 moving parts. Three. That’s why our riders spend ₹0 on servicing while petrol scooter owners average ₹4,500/year. Less parts. Less problems. More ride. → Link in bio to book a test ride.”
Customer Story
Quote or story intro → Specific detail (savings, experience, moment) → Emotional payoff → Community CTA
80-120 words
Introduce customer → their specific numbers → their emotional moment → “Share your ride story with #OutrideEverything”
Objection Buster
Question (the objection) → Acknowledgment → Answer with data → Mic-drop closing line
50-80 words
“But what if it rains? → Valid question. → VoltEdge Bolt is IP67 rated — fully waterproof. Rides through Bangalore monsoon without flinching. → Your petrol scooter’s engine? Not so much.”
A/B Copy Testing System:
Test Element
Variants
Test Duration
Sample Size
Decision Metric
Headlines
3 variants per ad set — Savings vs. Performance vs. Identity angle
5 days or ₹3,000 spend
Min. 1,000 impressions per variant
CTR (TOFU), Conversion Rate (BOFU)
CTA Text
“Book Test Ride” vs. “Ride One Free” vs. “See It In Person” vs. “Calculate Your Savings”
5 days
Min. 500 clicks total
Click-through rate + downstream conversion
Email Subject Lines
2 variants per email — tested on 20% of list, winner sent to 80%
4 hours (open rate window)
Min. 2,000 recipients per variant
Open rate
Landing Page Headlines
2 variants
7-14 days
Min. 1,000 visitors per variant
Conversion rate (test ride bookings)
Long vs. Short Copy
Detailed (200+ words) vs. Concise (<80 words) — same message
5 days
Equal budget split
CTR + Conversion Rate combination
Copy Asset Inventory (Total Delivered):
Asset Category
Quantity
Formats
Ad Copy Sets
75
15 core sets × 5 platform adaptations
Video Scripts
24
6 types × 4 scripts each (with shot directions)
Landing Page Copy
3
Main product page + Bolt-specific + Glide-specific
Email Sequences
14
Test ride nurture (7) + Post-purchase onboarding (7)
Social Captions
50
Templates + examples across 5 content types
Objection Copy Bank
24
12 objections × short-form + medium-form variants
Tagline Variants
8
Tested and ranked by audience response
Google Search Ad Copy
18
6 campaigns × 3 responsive search ad variants
SMS/WhatsApp Templates
12
Test ride reminders, post-ride follow-up, offer announcements
TOTAL
228 copy assets
Key Features Delivered
Feature
Description
Brand Messaging Architecture
6-layer framework from brand purpose to tagline (“Outride Everything”) — ensuring all copy ladders up to a unified brand story
Brand Voice Framework
4 voice attributes (Confident, Visceral, Straight-Talking, Challenger) with “sounds like / doesn’t sound like” examples and copy dos/don’ts
5-Angle Ad Copy System
Savings, Performance, Objection Killer, Identity, and Social Proof angles — each with 3 A/B variants and 5 platform adaptations (75 total ad copy sets)
6-Type Video Script Library
Hero brand films, product showcases, testimonials, objection busters, comparisons, and trend hooks — 24 complete scripts with shot directions and audio notes
Landing Page Copy Architecture
8-section conversion-optimized copy framework with hero, pain-solution, feature-benefit translator, social proof, FAQ, comparison, savings calculator, and CTA
Email Nurture Sequences
14 emails across test ride nurture (7) and post-purchase onboarding (7) — with subject line variants, timing strategy, and A/B testing plan
Objection-Handling Copy Bank
12 common EV purchase objections with short-form (social/ad) and medium-form (FAQ/email) copy responses backed by data and customer quotes
Social Caption Framework
5 content-type caption structures with length guidelines, hook strategies, and CTA patterns
A/B Copy Testing System
Structured testing framework for headlines, CTAs, subject lines, landing page copy, and copy length — with clear methodology and decision criteria
228 Copy Assets
Complete deliverable library covering ads, scripts, landing pages, emails, social captions, objections, taglines, search ads, and messaging templates
Challenge: VoltEdge EV — a Bangalore-based electric scooter brand with genuinely superior products (120km range, 150Nm torque, 5-year warranty, 4.8★ reviews) — had marketing copy that read like engineering spec sheets. Ad CTR was 0.7% (vs. 2%+ benchmark). Landing page conversion was 1.4%. Video watch-through was 18%. No brand voice, no emotional messaging, no objection handling, no structured copy system. Competitors like Ather sold identity and feeling; VoltEdge sold “BLDC hub motor architecture.”
Solution: We built a complete ad copywriting and script system — a 6-layer brand messaging architecture with “Outride Everything” tagline; a 4-attribute brand voice framework; 75 ad copy sets across 5 angles (Savings, Performance, Objection, Identity, Social Proof) adapted for Meta, YouTube, and Google; 24 video scripts across 6 types with shot directions; 3 conversion-optimized landing page copy sets; 14-email nurture sequences; a 12-objection copy bank with data-backed responses; social caption frameworks; and a structured A/B testing system. Total: 228 copy assets.
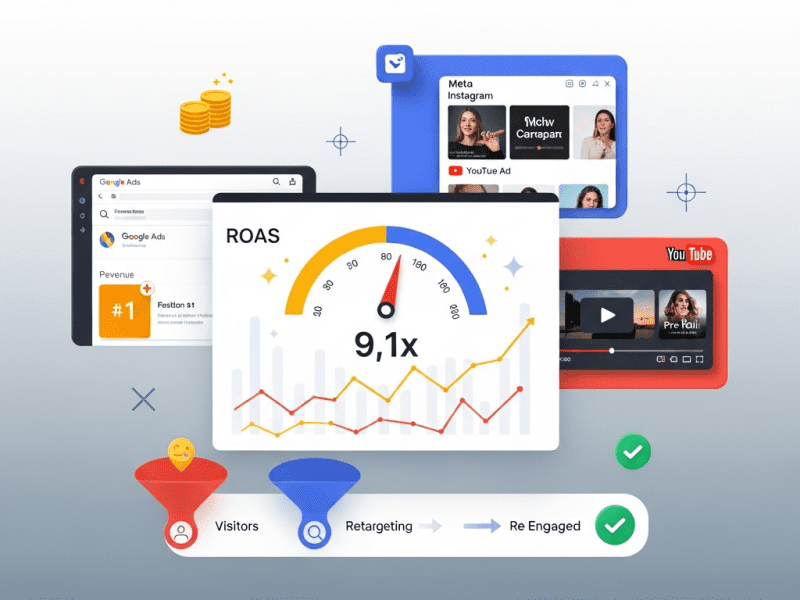
Result: Ad CTR jumped 186% (0.7% → 2.0%). Landing page conversion grew 142%. Video watch-through reached 52%. Email open rates hit 34% (from 12%). Test ride bookings grew 217%. Test-ride-to-purchase conversion improved 78% through copy-driven nurture. Monthly revenue from copy-optimized channels grew 391% to ₹1.08Cr. Cost per acquisition dropped 82%. The savings copy angle achieved 3.4% CTR — nearly 5x the original baseline. Words sell. The right words sell a lot more.
Great Products Fail Because of Bad Words
We write ad copy and scripts that turn features into feelings, specs into stories, and browsers into buyers — with brand messaging frameworks, video scripts, landing page copy, email sequences, and A/B testing systems that make every word earn its place.
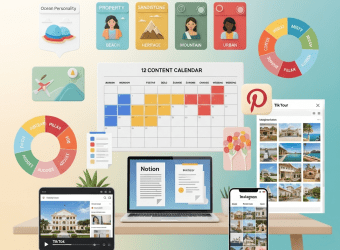
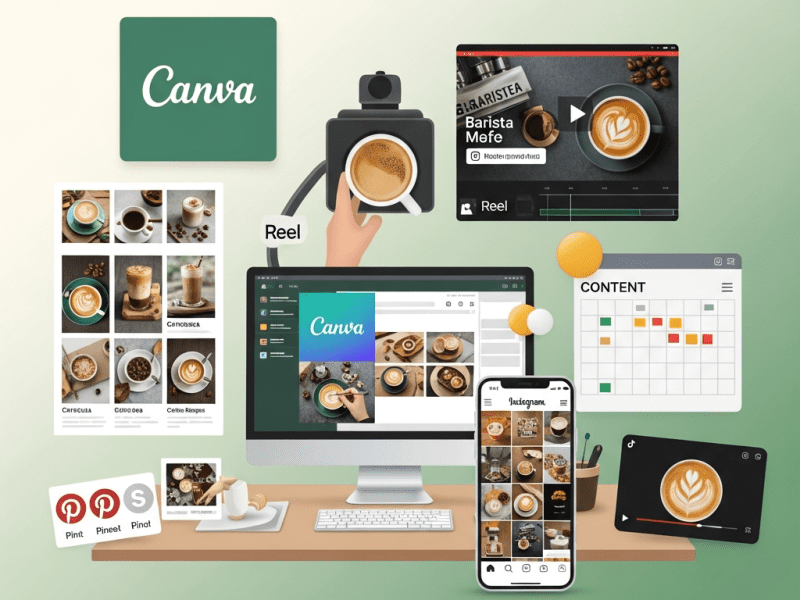
We designed a complete social media strategy and content calendar system for TerraBlu Hotels & Resorts — building a 12-month strategic roadmap across 5 platforms for 4 properties, creating a content engine that produces 340+ coordinated posts monthly, increasing direct bookings from social by 312%, and transforming an inconsistent, reactive social presence into a systematically planned, brand-unified storytelling machine.
Social Media Audit & Competitive Analysis, Brand Voice & Personality Framework, Audience Persona Development, Platform Strategy & Channel Architecture, Content Pillar Framework & Theme System, Annual Campaign Calendar & Seasonal Planning, Monthly/Weekly Content Calendar System, Content Ideation Engine & Prompt Library, Cross-Property Content Coordination, KPI Framework & Goal-Setting System, Governance Model & Approval Workflows, Strategy Documentation & Team Training
Tools & Platforms Used
Notion (strategy hub & content calendar), Airtable (content database & editorial pipeline), Google Sheets (KPI tracking & reporting), Later (scheduling & visual planning), Canva Pro (content templates), ChatGPT API (OpenAI) (content ideation), Google Analytics 4, Meta Business Suite (Instagram/Facebook insights), TikTok Analytics, YouTube Studio, Pinterest Analytics, Brandwatch (social listening), SparkToro (audience research), Semrush (competitor social tracking), Slack (team communication), Loom (training videos), Google Drive
Project Year
2025
The Overview
TerraBlu Hotels & Resorts is a boutique hospitality group operating 4 distinctive properties across South India — a beachfront wellness resort in Varkala (Kerala), a heritage haveli in Hampi (Karnataka), a hill station retreat in Kodaikanal (Tamil Nadu), and a contemporary urban boutique hotel in Pondicherry. Each property has a unique personality, target audience, and experience offering — from Ayurvedic spa treatments and yoga retreats in Varkala to archaeological tours and sunset dinners in Hampi, misty nature walks and colonial-era charm in Kodaikanal, and French-quarter culture and seaside cafés in Pondicherry.
TerraBlu had built a cult following among discerning travelers — a 4.7-star average across 2,400+ Google Reviews, consistent TripAdvisor “Travellers’ Choice” badges, and an occupancy rate that outperformed most indie hotel groups. Their guests loved them. Their Instagram told a completely different story.
Four properties, four separate Instagram accounts, four different brand identities — or rather, four different levels of chaos. Varkala’s account posted sunrise beach photos with motivational quotes in Comic Sans. Hampi’s account went silent for weeks, then posted 12 photos in one day. Kodaikanal’s account was a personal photo dump by the property manager with inconsistent filters. Pondicherry’s account was the “best” — but even that was reactive, posting only when someone remembered to.
There was no unified brand voice, no content strategy, no content pillars, no editorial calendar, no seasonal campaign plan, no platform-specific approach, no audience personas, no competitor benchmarking, no KPI framework, and no governance model. “Social media strategy” meant “post something nice when you feel like it.” In a hospitality industry where 74% of travelers use social media to choose their next destination (Stackla) and 40% of travelers under 30 consider “Instagrammability” a top factor in booking decisions (Schofields), this was a critical business vulnerability.
We designed and implemented a complete social media strategy and content calendar system — from brand-level strategic framework and audience personas to platform architecture, content pillar systems, 12-month campaign calendars, weekly content planning workflows, cross-property coordination, and team training — giving TerraBlu a unified, strategic, systematically planned social media presence that drives discovery, inspires wanderlust, and converts followers into guests.
The Challenge
No Social Media Strategy Whatsoever: No documented strategy, no goals, no target audience definition, no competitive positioning, no content pillars, no platform rationale, no measurement framework. Ask the team “What’s our social media strategy?” and you’d get four different shrugs from four different properties. Social media was treated as a chore, not a channel — something to “do” rather than something to “win with.”
4 Properties, 4 Levels of Chaos:
Property
Instagram Handle
Followers
Posting Frequency
Content Quality
Brand Consistency
Varkala (Wellness Resort)
@terrablu.varkala
8,200
2-5 random posts/week
Medium — decent photos, terrible typography, motivational quote spam
None — looks like a wellness influencer’s personal page, not a hotel
Hampi (Heritage Haveli)
@terrablu.hampi
3,400
0-12 posts/week (feast or famine)
Low — blurry phone photos, no editing, no composition awareness
None — looks like a tourist’s vacation album
Kodaikanal (Hill Station Retreat)
@terrablukoday
5,100
1-3 posts/week
Low-Medium — property manager’s personal style, overfiltered landscapes
None — handle doesn’t even match brand naming convention
Pondicherry (Urban Boutique)
@terrablupdy
11,800
3-4 posts/week
Medium-High — best of the four, but still reactive and unplanned
Partial — closest to brand feel but no documented guidelines
Brand Account
None existed
0
N/A
N/A
No parent brand presence at all
Reactive, Not Strategic Content:
What They Were Posting
What They Should Have Been Posting
Random sunset/landscape photos with generic captions
Strategically timed travel inspiration content aligned with booking windows
Chef profiles, artisan partnerships, “Meet the person who makes your experience special”
Zero Seasonal/Campaign Planning:
Opportunity Missed
Impact
Summer vacation season (April-June)
No family vacation campaign while competitors ran massive “Summer Escape” promotions — lost to Airbnbs and OTAs
Monsoon season (July-Sept)
Properties went nearly silent during monsoon — despite Kerala monsoon retreats being a trending wellness segment. Missed the entire “monsoon is romantic/rejuvenating” narrative
Festive season (Oct-Dec)
Generic “Happy Diwali” graphics instead of Diwali staycation packages, Christmas retreat bookings, New Year’s Eve events — peak booking period underexploited
Wedding season (Nov-Feb)
Zero destination wedding content despite Hampi and Pondicherry being top wedding destinations. No wedding showcase, no venue tours, no testimonials
Long weekends / public holidays
No countdown campaigns, no last-minute availability posts, no FOMO content before 3-day weekends — when impulse travel bookings spike
Valentine’s Day / Anniversary
No couples retreat campaigns, no romantic experience showcases, no special packages promoted
TerraBlu: No partnerships, no personality, no TikTok
No Content Planning Infrastructure: No editorial calendar tool, no content database, no ideation system, no approval workflow, no asset organization, no content repurposing framework. Content “planning” was a WhatsApp group where someone would say “Can someone post something today?” at 4 PM — leading to a rushed, low-quality, strategically meaningless post by 6 PM.
Our Approach & Strategy
Phase 1: Social Media Audit, Audience Research & Competitive Analysis (Week 1)
Comprehensive Social Media Audit — All 4 Properties:
Audit Area
What We Analyzed
Methodology
Content Audit
Last 12 months of posts across all 4 accounts: content type, topic, quality score (1-10), engagement, posting time, hashtags, captions
Manual review + export to Airtable (580+ posts cataloged)
Audience Audit
Current follower demographics, geographic distribution, age/gender breakdown, active hours, follower growth patterns
Meta Business Suite insights + SparkToro audience research
The Thoughtful Explorer — warm, curious, cultured, unhurried, deeply connected to place and people
Think: a well-traveled friend who knows the best-kept secrets, tells compelling stories, and never rushes you
Voice Characteristics
Warm (not corporate), Evocative (paints a picture), Knowledgeable (without being academic), Inviting (without being salesy), Grounded (real, not fabricated luxury)
Every caption should feel like a letter from a place, not an ad for a product
Tone adapts to property personality while maintaining consistent brand voice
Language Style
Sensory language (sounds, textures, scents, tastes), present tense for immersive effect, second person (“you”) to place the reader in the experience, short paragraphs, conversational flow
“The morning mist wraps around the eucalyptus trees as you step onto the verandah. Your coffee is already waiting.” — NOT: “Experience our scenic mountain views. Book now!”
The Curator — stylish, culturally fluent, vibrant, cosmopolitan
Lively, culturally rich, visually bold, artistic
French pastels (yellow, pink, blue), bougainvillea, vintage architecture, café culture, bicycle rides, street art
French Quarter walks, café culture, local art & design, Franco-Tamil cuisine, bicycle tours, boutique shopping, sunset promenade, cultural festivals
Content Pillar Framework (6 Pillars):
Pillar
Purpose
Content Types
% of Mix
Applies To
🌍 Destination Stories
Inspire discovery, position properties within destinations, drive saves for future trips
“48 hours in [destination]” guides, hidden gem spotlights, seasonal destination features, local food trails, cultural deep-dives, photo walks, “things to do” lists
25%
All 4 properties
✨ Experience & Moments
Showcase what guests feel (not just what they see), create emotional desire
Guest experience narratives, signature rituals (morning yoga, sunset cocktails, chef’s table), sensory moments (coffee on the verandah, rain on the terrace), activity spotlights
25%
All 4 properties
👥 People & Stories
Build emotional connection, humanize the brand, celebrate community
Chef profiles, therapist stories, housekeeper spotlights, guest stories (with permission), local artisan partnerships, founder’s journey, team celebrations
15%
All 4 properties
🎓 Travel Knowledge
Provide value, drive saves/shares, position as travel authority
Packing guides, travel tips, cultural etiquette, Ayurvedic wellness tips, coffee/food education, photography tips for each destination, “what to wear” guides
15%
Brand account + Property accounts
🎉 Campaigns & Experiences
Drive bookings, promote packages, announce events and seasonal offerings
Single select: 🏆 Top Performer / ✅ Good / 📊 Average / ⬇️ Below Average
Coded after performance review
Notes
Long text
Internal notes, learning, why it worked/didn’t
Content Ideation Engine (AI-Assisted with ChatGPT):
Ideation Method
Process
Output
Frequency
Monthly Ideation Sprint
2-hour team session: Review past month performance → Identify winning content angles → Brainstorm concepts for next month → Map to pillars/themes → Assign
80-100 content ideas captured in Airtable
Monthly
AI Prompt Library
120 pre-built ChatGPT prompts organized by pillar, property, format, and campaign — team selects prompt, inputs specifics, gets draft caption/concept
Quick caption drafts, carousel outlines, video scripts, hashtag suggestions
On-demand
Trending Content Adaptation
Weekly monitoring of hospitality/travel trends on Instagram Reels, TikTok, and Pinterest → Adapt trending formats to TerraBlu brand
3-5 trend-adapted content ideas/week
Weekly
Guest Insight Mining
Review latest Google Reviews, TripAdvisor reviews, and guest feedback forms → Extract what guests loved most → Turn into content
5-8 content ideas from guest language/stories
Bi-weekly
Seasonal Content Bank
Pre-built content idea banks for each season/festival, stored in Notion — ready to activate each year
Semrush Social Tracker + manual review of competitor posts with highest engagement → Analyze what works → Create TerraBlu’s version (never copy — be inspired, then elevate)
3-5 competitor-inspired ideas/month
Monthly
AI Prompt Library (Sample Prompts — 120 Total):
Pillar
Prompt Category
Sample Prompt
🌍 Destination
Caption — Destination Guide
“Write an Instagram caption for a carousel titled ’48 Hours in Hampi — A First-Timer’s Guide.’ Tone: The Thoughtful Explorer — warm, curious, wonder-filled. Include 8 must-do experiences. End with a save CTA. Max 200 words.”
✨ Experience
Caption — Sensory Moment
“Write a sensory-rich Instagram caption describing the experience of waking up at TerraBlu Kodai — the misty morning, eucalyptus scent, warm blanket, coffee on the verandah. Tone: The Dreamer — whimsical, cozy. Use present tense, second person (‘you’). Max 150 words.”
👥 People
Story Script — Staff Spotlight
“Write a 5-slide Instagram Story script spotlighting Chef Lakshmi, head chef at TerraBlu Varkala for 12 years. Include: her background, her philosophy on Ayurvedic cooking, her signature dish, a fun personal fact, and a ‘come taste her cooking’ CTA. Tone: warm, respectful, celebratory.”
🎓 Knowledge
Carousel Outline — Travel Tips
“Create a 10-slide Instagram carousel outline for ‘The Ultimate Monsoon Packing List for Kerala.’ Each slide: headline + 2-3 bullet points. Include practical advice with TerraBlu brand personality — warm, knowledgeable, slightly playful.”
🎉 Campaign
Ad Copy — Seasonal Package
“Write 3 Instagram ad copy variations for TerraBlu’s ‘Monsoon Wellness Retreat’ package at Varkala. Package: 5N/6D Ayurvedic retreat, ₹42,000/person, includes daily yoga, 3 Ayurvedic treatments, full-board meals. Tone: serene but compelling. Variation 1: Emotional/aspirational, Variation 2: Practical/value-focused, Variation 3: Urgency/limited availability.”
🤝 Community
UGC Feature
“Write a caption for resharing a guest’s photo at TerraBlu Hampi. Guest name: Priya. She posted a sunset photo from the rooftop with caption ‘This changed me.’ Acknowledge her experience warmly, invite others to share their moments, include #TerraBluMoments hashtag.”
Content Production Workflow:
WEEKLY CONTENT PRODUCTION CYCLE ━━━━━━━━━━━━━━━━━━━━━━━━━━━━━━━
FRIDAY (Previous Week) — PLANNING: → Content Manager reviews monthly calendar → Selects next week's content from planned ideas → Assigns each piece to team member/property → Status in Airtable: 💡 Idea → ✍️ Draft (assigned) → Sends creative brief via Slack to property teams
MONDAY — PRODUCTION START: → Property teams shoot required photos/videos → Designer begins graphic/template work in Canva → Caption writers draft captions (AI-assisted → human polished) → Status: ✍️ Draft (in progress)
TUESDAY — PRODUCTION CONTINUED: → Video editing (Reels/TikToks) in CapCut → Carousel design finalized → Captions finalized with hashtag sets → Assets uploaded to content record in Airtable → Status: ✍️ Draft → 👁️ Review
THURSDAY — SCHEDULING: → All approved content loaded into Later → Instagram grid preview checked (aesthetic flow) → Optimal posting times set per platform → First-comment hashtags loaded → Stories scheduled with interactive elements → Pinterest pins scheduled → Status: ✅ Approved → 📅 Scheduled
FRIDAY–SUNDAY — LIVE MANAGEMENT: → Content publishes automatically → Community manager monitors comments/DMs → Real-time Story content (BTS, daily updates) → Weekend planning for next week begins (cycle restarts) → Post-publish: Status → 📤 Published
FOLLOWING TUESDAY — PERFORMANCE REVIEW: → 5-day performance data captured for last week's content → Engagement metrics entered in Airtable → Performance tags assigned (🏆 Top / ✅ Good / 📊 Average / ⬇️ Below) → Learnings noted → Status: 📤 Published → 📊 Measured ━━━━━━━━━━━━━━━━━━━━━━━━━━━━━━━━━━━━━━━━━━━━━━━━━━
Guest consent form signed/verbal recorded → then standard approval flow
Legal review if identifiable minors or sensitive contexts
Brand Guardrails (Do’s and Don’ts Document):
Category
✅ Do
❌ Don’t
Visual
Use warm, natural tones aligned with brand palette. Show people in spaces (not empty rooms). Prioritize golden hour and natural light.
Never use heavy filters, neon overlays, or stock photos. No clip art, no WordArt, no Comic Sans.
Voice
Write as The Thoughtful Explorer — warm, evocative, knowledgeable. Use sensory language and present tense.
Never use aggressive sales language (“BOOK NOW!!! LIMITED OFFER!!!”), generic corporate speak, or slang/memes that don’t fit brand personality.
Promotions
Frame offers within storytelling — “This monsoon, heal at Varkala” with package details naturally integrated.
Never post just a price and a “Book Now” button without context, story, or visual appeal.
Guest Content
Always ask permission. Credit guests. Celebrate their experience.
Never repost without explicit consent. Never post identifiable children without parental consent. Never post content where guests are in compromising situations.
Competitor
Monitor, learn, be inspired, elevate.
Never name, tag, or reference competitors — even positively. Never engage in comparison marketing.
Sensitive Topics
Handle with care: natural disasters, political events, cultural sensitivities. Pause scheduled content if a major event occurs.
Never post scheduled promotional content during national tragedies or natural disasters affecting the region. Have a “pause all” protocol.
Staff Content
Celebrate, appreciate, credit. Show genuine moments.
Never post staff content without their consent. Never mock, embarrass, or show staff in unflattering situations.
Crisis Content Protocol:
CRISIS CONTENT PROTOCOL
━━━━━━━━━━━━━━━━━━━━━━━

LEVEL 1 — MINOR (Negative review/comment, small factual error)
  → Community Manager handles directly (response guidelines provided)
  → Notify Content Manager via Slack
  → No scheduled content changes needed

LEVEL 2 — MODERATE (Viral negative post about property, misleading media coverage)
  → Pause all scheduled promotional content for affected property (24h)
  → Content Manager drafts response, Marketing Head approves
  → Activate "soft content" only — atmospheric, non-promotional
  → Review and respond within 4 hours

LEVEL 3 — SEVERE (Natural disaster in destination area, safety incident, national crisis)
  → IMMEDIATELY PAUSE ALL SCHEDULED CONTENT (all properties, all platforms)
  → Marketing Head + GM align on response within 2 hours
  → If TerraBlu is directly affected: Empathetic statement (approved by leadership)
  → If regional/national event: Silence scheduled content until appropriate to resume
  → Resume with sensitivity — no "back to business as usual" tone for 48-72h
  → Acknowledgment post if relevant before returning to regular content

PAUSE ALL BUTTON: Later allows one-click pause of all scheduled content across all accounts — Content Manager has access
━━━━━━━━━━━━━━━━━━━━━━━━━━━━━━━━━━━━━━━━━━━━━━━━━━━━━━
Phase 6: KPI Framework, Team Training & Strategy Handover (Week 6)
Why social media strategy matters for hospitality, our strategic framework, 12-month roadmap, role of each property, how success is measured
Brand Voice & Content Guidelines
Content creators + property Content Champions
3 hours
Live workshop + printed reference guide
Brand voice deep-dive, property personalities, writing exercises, caption dos/don’ts, visual guidelines, common mistakes to avoid
Content Calendar System Training
Content team
2 hours
Live demo + Loom screen recording
Notion strategy hub navigation, Airtable content database operations, how to create/assign/track content pieces, status workflow
Photography & Video for Properties
Property Content Champions (4 people)
4 hours
Hands-on at property
Phone photography masterclass (composition, lighting, angles for hospitality), quick video techniques (room reveals, food shots, ambience), Lightroom preset application
Caption Writing Workshop
Content creators
2 hours
Live workshop
Writing in brand voice, sensory language exercises, CTA integration, AI prompt library usage, hashtag strategy
Scheduling & Publishing
Content Manager + backup
1.5 hours
Live demo + Loom
Later setup, scheduling workflow, grid preview, Story scheduling, multi-platform publishing, first-comment automation
Performance Tracking
Content Manager + Marketing Head
1.5 hours
Live demo + Loom
Airtable metrics tracking, monthly report generation, KPI dashboards, how to read platform analytics, how to make data-driven decisions
Crisis Protocol
All marketing team + property GMs
1 hour
Live briefing + printed protocol card
Crisis levels, pause protocol, response frameworks, escalation chain, role assignments
Strategy Documentation Package (Delivered):
Document
Pages/Size
Purpose
Access
Social Media Strategy Bible
65 pages (Notion)
Master strategy document — everything from audit findings to persona details to pillar rationale to platform strategy to brand voice to governance model
Marketing team + Leadership
Content Pillar Guide
18 pages (PDF)
Detailed guide for each content pillar — purpose, content types, examples, frequency, do’s/don’ts, inspiration board
Interactive Notion calendar + Google Sheets backup
Annual campaign plan with monthly themes, lead properties, objectives, booking windows
Content Manager + Marketing Head
Weekly Theme System
2-page reference card (PDF)
Monday through Sunday recurring themes with content type and pillar mapping
All content creators (printed for each property)
Content Calendar System SOP
10 pages (Notion)
Step-by-step operating procedures for the entire content planning → production → scheduling → measurement workflow
Content team
AI Prompt Library
120 prompts (Notion database)
Organized by pillar, property, format, and campaign — searchable, with usage instructions
Content creators
Seasonal Content Idea Banks
200+ ideas (Notion database)
Pre-built ideas for each season, festival, and event — ready to activate annually
Content team
Photography & Video Direction Guide
15 pages (PDF)
Shot-by-shot guidance for every content type by property — camera angle, lighting, composition, mood
Property Content Champions
Crisis Protocol Card
1 page (laminated card)
Quick-reference crisis response protocol with escalation contacts
All marketing team + property GMs (kept at front desk)
Monthly Report Template
Google Slides template + Airtable views
Pre-formatted 12-section monthly report template — just add data
Content Manager
Governance & Approval Flowchart
1-page visual flowchart (PDF)
Visual workflow showing who approves what, when, and how
All team members
Key Features Delivered
Feature
Description
Comprehensive Social Media Audit
580+ posts cataloged and analyzed across 4 properties — content, audience, performance, competitor, platform, and brand consistency audits with actionable findings
4 Audience Personas
“Weekend Escape Rhea,” “Wellness Seeker Ananya,” “Culture Explorer Vikram,” and “Celebration Planner Meera” — each with demographics, travel style, content preferences, booking behavior, and primary platform
Brand Voice & Personality Framework
“The Thoughtful Explorer” brand personality with voice characteristics, tone spectrum, vocabulary guide, emoji framework, and 4 property-specific personality cards
6-Pillar Content Framework
Destination Stories, Experience & Moments, People & Stories, Travel Knowledge, Campaigns & Experiences, Community & UGC — with percentage mix, content types, and pillar-specific guidelines
5-Platform Channel Architecture
Instagram (5 accounts), Pinterest, YouTube, TikTok, and Facebook — each with defined role, content focus, target persona, posting frequency, and account structure
12-Month Campaign Calendar
Month-by-month campaign themes mapped to lead properties, seasonal objectives, and booking windows — from “New Year, New Places” through “Year-End Magic”
Weekly Theme System
7-day recurring content theme cycle (Monday Escape through Slow Sunday) ensuring consistent variety and pillar balance
4-Layer Content Calendar System
Strategic Layer (Notion) → Editorial Layer (Notion) → Production Layer (Airtable) → Scheduling Layer (Later) — from annual strategy to daily publishing
Airtable Content Database
20+ field content pipeline with status workflow (Idea → Draft → Review → Approved → Scheduled → Published → Measured), per-post performance tracking, and cross-property coordination
Content Ideation Engine
6 ideation methods including monthly sprints, AI prompt library (120 prompts), trend monitoring, guest insight mining, seasonal content banks, and competitor inspiration analysis
Cross-Property Content Coordination
5-level content model (brand / property signature / property daily / cross-property / UGC) with distribution matrix showing posting, resharing, cross-promotion, and adaptation paths
Governance Model
Approval workflows by content type, brand guardrails document, and 3-level crisis content protocol with “pause all” capability
Layered KPI Framework
7 measurement layers from Awareness through Revenue and Brand Health — with property-level, platform-level, pillar-level, and campaign-level analysis
OKR-Aligned Goals
5 strategic objectives with measurable key results and timelines — brand recognition, direct bookings, content excellence, monsoon season activation, and multi-platform presence
Complete handover documentation including 65-page Strategy Bible, pillar guides, personality cards, campaign calendar, AI prompt library, seasonal idea banks, SOPs, crisis protocol, and report templates
18 hours (structured, but producing 5x more content at higher quality)
Efficiency ⬆ 350%
UGC Generated (#TerraBluMoments)
~8/month (unmanaged)
85+/month
⬆ 963%
Team Content Capability Score (Self-Assessment)
3.2/10
8.4/10
⬆ 163%
Wedding Inquiries from Social (Monthly)
2
14
⬆ 600%
Brand Mentions (Organic, Monthly)
~40
280+
⬆ 600%
Competitor Share of Voice (vs. Top 4 Competitors)
4% (5th of 5)
18% (2nd of 5)
⬆ 350%
📋 Case Study Summary
Challenge: TerraBlu Hotels & Resorts — a 4-property boutique hospitality group across South India (Varkala, Hampi, Kodaikanal, Pondicherry) with 4.7-star reviews and loyal guests — had zero social media strategy. Four properties ran four chaotic, inconsistent Instagram accounts with no brand voice, no content pillars, no editorial calendar, no seasonal campaigns, no audience personas, no multi-platform presence (zero Pinterest, YouTube, or TikTok), and no governance model. Social media was reactive — “post something when you remember.” In an industry where 74% of travelers use social to choose destinations, this was a critical business vulnerability. Competitors like SaffronStays and Evolve Back dominated travel social media while TerraBlu was invisible.
Solution: We designed a complete social media strategy and content calendar system — starting with a 580-post audit across all properties; developing 4 traveler personas; building “The Thoughtful Explorer” brand voice framework with 4 property-specific personality cards; creating a 6-pillar content framework; architecting a 5-platform channel strategy (Instagram, Pinterest, YouTube, TikTok, Facebook) with account restructuring; designing a 12-month campaign calendar with seasonal themes mapped to booking windows; implementing a weekly 7-day theme system; building a 4-layer content calendar infrastructure (Notion strategy → Notion editorial → Airtable production pipeline → Later scheduling); creating a content ideation engine with 120 AI prompts and 200+ seasonal ideas; establishing cross-property coordination with distribution matrix; implementing a governance model with crisis protocol; setting up a 7-layer KPI framework with OKR-aligned goals; delivering 8 training modules (18+ hours); and handing over a 12-document strategy package including a 65-page Strategy Bible.
Result: Content output grew from 65 to 340+ monthly pieces across all platforms and properties. Brand consistency scored 8.8/10 (from 2.4). Combined Instagram followers grew 139%. Engagement rate jumped 200%. Save rate increased 800%. Pinterest reached 620K monthly impressions from zero. YouTube gained 6,400 subscribers. TikTok hit 18,200 followers. Social-to-website traffic grew 617%. Direct bookings from social increased 312%. Revenue attributed to social grew 363%. Monsoon occupancy at Varkala jumped from 35% to 78% through strategic monsoon campaign. Wedding inquiries from social grew 600%. TerraBlu’s share of voice against top competitors rose from 4% to 18%.
Posting Without a Strategy Is Just Making Noise
We build social media strategies and content calendar systems that give your brand a clear voice, a purposeful plan, and a production engine — transforming reactive posting into systematic storytelling that builds audiences, drives action, and delivers measurable business results.
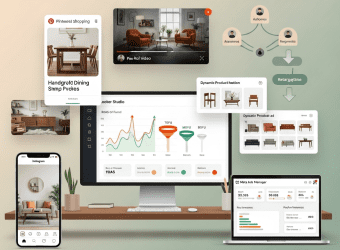
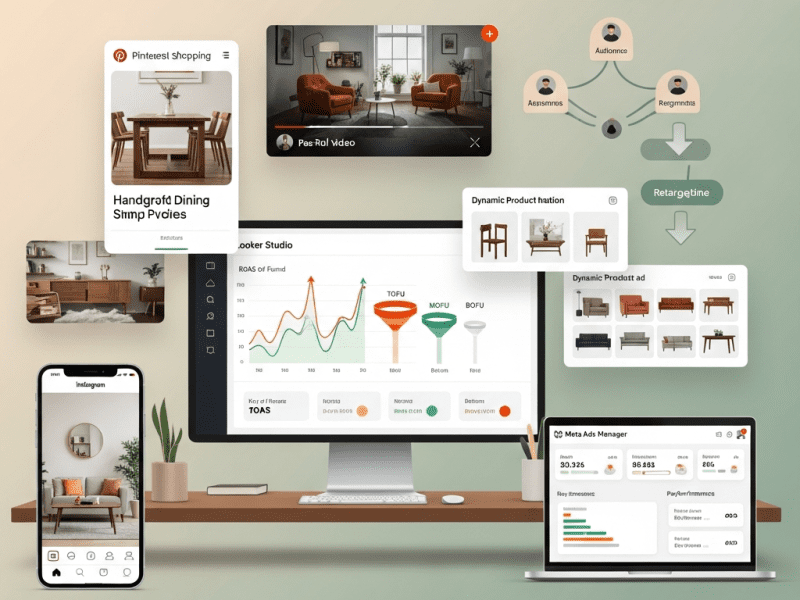
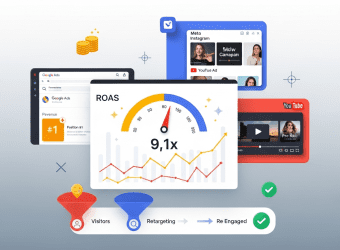
We designed and launched a complete social media advertising system for NestCraft Living — building a full-funnel paid social engine across Meta, Pinterest, and YouTube that generated ₹1.84Cr in attributed revenue over 6 months at a blended 6.8x ROAS, reducing cost-per-acquisition by 62% and transforming paid social from their weakest channel into their primary revenue driver.
Meta Business Suite, Meta Ads Manager, Pinterest Ads Manager, Google Ads (YouTube), Meta Pixel, Pinterest Tag, Google Tag Manager, Google Analytics 4, Shopify (storefront + product catalog), Triple Whale (attribution), Canva Pro, CapCut Pro, ChatGPT API (OpenAI), Midjourney (lifestyle ad imagery), Notion, Google Sheets, Looker Studio, Zapier, Slack, Hotjar (landing page heatmaps)
Project Year
2025
The Overview
NestCraft Living is a D2C home furniture and decor brand based in Pune, offering a curated range of 240+ products — from solid sheesham wood dining tables and handwoven jute rugs to modular bookshelves, artisan ceramic planters, and handcrafted brass lighting. Every piece is designed in-house, sustainably sourced, and manufactured by Indian artisan clusters. Their price point sits in the premium-accessible range — a 6-seater dining table at ₹38,000, a handwoven rug at ₹5,500, a statement bookshelf at ₹22,000.
Their Shopify store was beautifully designed. Product photography was excellent — lifestyle room settings, close-up material shots, 360-degree views. Customer reviews averaged 4.5 stars across 1,800+ reviews. Organic traffic was healthy, and their email list of 28,000 subscribers drove consistent repeat purchases.
But paid social media advertising — the channel that should have been their growth engine — was hemorrhaging money.
NestCraft had been running Facebook and Instagram ads in-house for 14 months. They’d spent ₹42 lakh total. Their blended ROAS (Return on Ad Spend) was 1.6x — meaning for every ₹1 spent on ads, they made ₹1.60 in revenue. After product costs, shipping, returns, and overheads, they were losing money on every ad-acquired customer. Their cost-per-acquisition was ₹2,800 — on products with an average order value of ₹4,500 and a gross margin of 45%. The math didn’t work.
The problem wasn’t that paid social doesn’t work for furniture. Competitors like Wakefit, Urban Ladder, and Wooden Street were scaling aggressively through Meta and YouTube ads. The problem was how NestCraft was doing it — boosted posts instead of proper campaigns, no funnel structure, no retargeting, no dynamic product ads, zero presence on Pinterest (the highest-intent home decor platform), no YouTube ads despite having beautiful video content, and creative fatigue from running the same 5 ad sets for months.
We built a complete social media advertising system — from full-funnel campaign architecture and audience segmentation to creative strategy, dynamic product ads, multi-platform retargeting, budget allocation frameworks, and a performance optimization playbook — transforming NestCraft’s paid social from a money pit into a predictable, scalable revenue machine.
The Challenge
Abysmal Ad Performance Despite Significant Spend:
Metric
NestCraft (Before)
Industry Benchmark (Home Decor D2C)
Gap
Blended ROAS
1.6x
4.0x–6.0x
60–73% below benchmark
Cost Per Acquisition (CPA)
₹2,800
₹800–₹1,200
133–250% above benchmark
Click-Through Rate (CTR)
0.6%
1.2%–2.0%
50–70% below benchmark
Cost Per Click (CPC)
₹18.40
₹6–₹10
84–207% above benchmark
Conversion Rate (Ad → Purchase)
0.8%
2.0%–3.5%
60–77% below benchmark
Ad Frequency (Avg)
8.4
<3.0
180% above (massive creative fatigue)
Total Spend (14 months)
₹42,00,000
—
—
Total Revenue from Ads
₹67,20,000
—
—
Net Profit from Ads
Negative (after COGS, shipping, returns)
—
Losing money on every acquisition
“Boost Post” Mentality — No Proper Campaign Structure: NestCraft’s “advertising strategy” was literally pressing the blue “Boost Post” button on their best-performing organic Instagram posts. No campaign objectives beyond “engagement,” no ad sets with proper targeting, no conversion optimization, no funnel stages. They were paying for likes, not for purchases. Facebook’s algorithm was optimizing for the cheapest engagement (people who like posts but never buy), not for high-intent purchasers.
Zero Funnel Architecture: Every ad sent cold traffic directly to the homepage with a “Shop Now” CTA. No awareness campaigns building brand familiarity. No consideration campaigns educating about craftsmanship and quality. No retargeting campaigns recapturing the 97% of visitors who left without buying. A person seeing NestCraft for the first time was shown the exact same ad as someone who’d visited the site 5 times and abandoned cart with ₹35,000 worth of furniture. No segmentation. No journey.
Single Platform Dependency: 100% of ad spend went to Meta (Facebook + Instagram). Zero presence on Pinterest — where 85% of users actively plan home decor purchases and purchase intent is 2.5x higher than any other social platform. Zero YouTube ads — despite having beautiful product and room-tour videos. Two massive, high-intent platforms completely untouched.
Creative Fatigue & Poor Ad Quality:
Problem
Details
5 ad creatives running for 8+ months
Same product photos recycled since launch — audience had seen each ad 8.4 times on average
No video ads
100% static images — in a category where video (room walkthroughs, material close-ups, assembly timelapses) dramatically outperforms static
No lifestyle imagery
Products photographed on white backgrounds — no room context, no aspiration, no “imagine this in your home”
Generic copy
“Shop premium furniture at NestCraft” — no storytelling, no craftsmanship narrative, no urgency, no social proof, no objection handling
Wrong formats
Single-image ads only — no carousels showcasing product range, no collection ads for room categories, no dynamic product ads showing items people actually browsed
No Conversion Tracking Infrastructure: Meta Pixel was installed but misconfigured — tracking page views but not “Add to Cart,” “Initiate Checkout,” or “Purchase” events. Without proper conversion data, Facebook’s algorithm couldn’t optimize for buyers. It was flying blind — finding people who click, not people who buy. No server-side tracking, no Conversions API, no UTM parameters, no attribution model beyond last-click.
Boosted posts, single images, no funnel, no retargeting, no video, no Pinterest/YouTube
No Budget Allocation Framework: The monthly ₹3L budget was spent arbitrarily — sometimes ₹2L in one week on a “performing” ad (that was performing by vanity metrics — likes, not sales), sometimes paused entirely when the founder felt “ads aren’t working.” No daily budget discipline, no campaign-level allocation, no scaling rules, no kill criteria for underperformers.
Limited-time offers, free shipping thresholds, festive sale
BOFU
Social Proof
Static + Video, 1:1 + 9:16
5 creatives
Customer review quotes overlaid on product images, star ratings, “2,400+ happy homes”
BOFU
“Still Thinking?” Retargeting
Static + Video (15 sec), 1:1
4 creatives
Shows exact product they viewed + incentive (“Free delivery on your first order”)
Post-Purchase
Cross-Sell
Carousel (4 slides), 1:1
4 carousels
“Complete Your [Room]” — complementary products based on purchase category
Post-Purchase
New Arrivals
Carousel + Video, 1:1 + 9:16
3 sets/month
Seasonal new product launches
Total Initial Creative Production: 72 ad creatives across all formats and funnel stages
Ad Creative Production System (Ongoing):
MONTHLY AD CREATIVE PRODUCTION CYCLE
━━━━━━━━━━━━━━━━━━━━━━━━━━━━━━━━━━━━━

WEEK 1 — ANALYSIS & PLANNING:
  → Review past month ad performance by creative
  → Identify: Top 5 performers (scale), Bottom 5 (kill), Fatigued (frequency > 4)
  → Analyze competitor ads (Meta Ad Library, Pinterest Trends)
  → Plan new creative concepts for each funnel stage
  → Create creative brief document

WEEK 2 — PRODUCTION:
  → Shoot new product/lifestyle photos (if needed)
  → Design static ads in Canva Pro (6–8 new)
  → Edit video ads in CapCut Pro (4–6 new)
  → Write ad copy variations (3 copy versions per creative)
  → Generate AI lifestyle imagery via Midjourney (room settings)
  → Create Pinterest-specific pin designs

WEEK 3 — TESTING:
  → Launch new creatives as A/B tests against current winners
  → Test: Creative (image/video) × Copy × Audience combinations
  → Budget: ₹500–₹1,000/day per test ad set (3-day test window)
  → Decision criteria: CTR, CPC, ATC rate (not ROAS — too early)

WEEK 4 — OPTIMIZATION:
  → Promote test winners to main campaigns
  → Kill underperformers (below threshold after 3 days + ₹2,000 spend)
  → Refresh ad copy on fatigued high-performers (new copy, same creative)
  → Update DPA catalog templates seasonally

MONTHLY OUTPUT: 15–20 new ad creatives
CREATIVE LIBRARY GROWTH: Cumulative testing builds a library of
  proven winners — by Month 6, 80+ tested creatives with clear
  performance data on each
━━━━━━━━━━━━━━━━━━━━━━━━━━━━━━━━━━━━━━━━━━━━━━━━━━━━━━━━
“Your home tells a story. Make it one worth telling. → NestCraft brings India’s finest artisan woodcraft to your living room — handcrafted from solid sheesham by 3rd-generation carpenters in Jodhpur. → Explore the collection ↗”
MOFU
Educational, value-driven, comparative
Hook → Product benefit/differentiation → Social proof → CTA (Shop/Browse)
“Not all ‘solid wood’ furniture is actually solid wood. Here’s how to tell. → Swipe through our guide to spotting quality craftsmanship → 4.5★ across 1,800+ reviews → Shop genuine solid wood →”
“Your Jodhpur Dining Table is on its way! 🎉 → Complete the look with matching chairs — 15% off your second order → Shop Dining Chairs →”
Dynamic Product Ads (DPA) Setup:
DPA Element
Configuration
Product Catalog
Shopify → Meta Commerce Manager sync — all 240+ products with: title, description, price, sale price, image URL, product URL, availability, category, material, room type
Catalog Segmentation
Product sets by: Room (Living Room, Bedroom, Dining, Study, Outdoor), Category (Tables, Seating, Storage, Lighting, Decor, Rugs), Price Range (<₹5K, ₹5K–₹15K, ₹15K–₹40K, ₹40K+), New Arrivals, Best Sellers, On Sale
DPA Template Design
Custom Canva-designed catalog ad frames: product image in center, NestCraft logo top-left, price tag bottom-right, “Free Delivery” badge (for qualifying products), material icon (wood/brass/jute)
DPA Retargeting Rules
Viewed product but didn’t ATC (show viewed product + 3 similar), ATC but didn’t purchase (show carted product with urgency), Purchased (show complementary products from same room category)
Pinterest Catalog
Shopify → Pinterest catalog sync, product pins auto-generated, shopping ads enabled across all product sets
DPA Performance Monitoring
Per-product ROAS tracked — products with ROAS < 3x after ₹2,000 spend are paused, top performers get increased bid
CHECK 1 — Spend Pacing: → Is daily spend tracking to monthly budget? (±10% variance OK) → Any campaign overspending? → Adjust daily budget → Any campaign underspending? → Check ad review status, audience saturation
CHECK 2 — BOFU ROAS: → ROAS > 5x → Scale: increase budget 20% (max every 3 days) → ROAS 3x–5x → Maintain: keep budget, monitor → ROAS 2x–3x → Optimize: test new creatives, check frequency → ROAS < 2x for 3+ days → Investigate: audience fatigue? creative fatigue? landing page issue? → ROAS < 1.5x for 5+ days → Kill: pause ad set, reallocate budget
CHECK 3 — Frequency: → TOFU frequency > 2.0 → Expand audience or refresh creative → MOFU frequency > 3.0 → Refresh creative, rotate messaging → BOFU frequency > 4.0 → Urgent: creative fatigue, performance will tank → All platforms: frequency < 1.0 → Budget may be too low or audience too broad
CHECK 5 — Creative Performance: → Any ad with CTR < 0.8% after ₹2,000 spend → Kill → Any ad with CPA > 2x target after ₹3,000 spend → Kill → Any ad delivering < 100 impressions/day → Check: ad rejected? audience too narrow? ━━━━━━━━━━━━━━━━━━━━━━━━━━━━━━━━━━━━━━━━━━━━━━━━━━━━━━━━
→ Review all campaigns: ROAS, CPA, CTR, Spend, Frequency → Pause underperforming ad sets (below threshold for 5+ days) → Scale winning ad sets (increase budget 20% — never more than 20% per adjustment) → Refresh ad copy on high-frequency winners → Review audience overlap (Audience Overlap tool — merge or exclude overlapping audiences) → Check auction insights: any new competitor bidding aggressively? → Update performance dashboard
→ Full funnel analysis: Is TOFU feeding MOFU? Is MOFU feeding BOFU? → Budget reallocation across funnel stages based on performance → Platform budget reallocation (Meta vs. Pinterest vs. YouTube) → Creative audit: which visual styles, video types, copy angles perform best? → Audience audit: which audiences have highest ROAS? Expand or create new LALs → Landing page analysis: conversion rate by landing page, heatmap review (Hotjar) → Competitive analysis: check Meta Ad Library for competitor creative changes → Plan next month's creative production and testing roadmap ━━━━━━━━━━━━━━━━━━━━━━━━━━━━━━━━━━━━━━━━━━━━━━━━━━━━━━━━━━━━━
Scaling Framework:
Scaling Method
When to Use
How
Risk Level
Vertical Scaling
Ad set with ROAS > 5x and frequency < 3
Increase budget 20% every 3 days (never jump more than 20% — Meta algorithm resets learning phase)
Low
Horizontal Scaling — Audience
Winning creative wants more reach
Duplicate winning ad into new audience (different LAL seed, new interest stack, different LAL %)
Medium
Horizontal Scaling — Platform
Winning creative/concept on one platform
Adapt winning Meta creative for Pinterest/YouTube
Medium
Horizontal Scaling — Placement
Winning in Feed, untested in Reels/Stories
Create placement-optimized versions of winning creative
Upcoming tests planned for next 3 months — what to test, why, expected impact
Notion roadmap
Seasonal Campaign Templates
Pre-built campaign structures, audience configurations, and creative briefs for each seasonal event
Notion + Canva templates
Reporting Template
Looker Studio dashboard + weekly/monthly report template
Looker Studio + Google Slides
Vendor & Tool Access
All platform logins, tool subscriptions, API keys, and third-party access documentation
Encrypted document
SOP — Crisis Playbook
What to do when: ad account gets flagged/disabled, ROAS drops below 2x suddenly, budget accidentally overspends, creative gets rejected
Notion SOP
Key Features Delivered
Feature
Description
Complete Conversion Tracking Infrastructure
Meta Pixel (8 events), Conversions API, Pinterest Tag, Google Tag Manager, GA4 Enhanced E-Commerce, Triple Whale attribution, UTM framework, and offline conversion tracking — capturing 30–40% more data than browser-only tracking
TOFU (Awareness) → MOFU (Consideration) → BOFU (Conversion/Retargeting) → Post-Purchase (Retention) — with distinct objectives, audiences, creatives, and KPIs per stage
3-Platform Paid Social Engine
Meta (60%), Pinterest (25%), YouTube (15%) — each with platform-native campaign structures, creative formats, and optimization strategies
72 Initial Ad Creatives
Videos, carousels, static images, dynamic product ads, Pinterest Idea Pins, and YouTube pre-rolls — organized by funnel stage, with 3 copy variations each
Dynamic Product Ads (DPA)
240+ product catalog synced from Shopify to Meta and Pinterest, segmented by room, category, and price range, with custom-designed catalog frames and automated retargeting rules
Monthly Creative Production System
4-week cycle: Analysis → Production (15–20 new creatives) → Testing → Optimization — building a growing library of proven performers
Structured A/B Testing Framework
8 test types (creative, copy, audience, format, landing page, placement, bid strategy, offer) with clear methodology, duration, budget, and decision criteria — producing 2–3 new proven winners monthly
Campaign Optimization Playbook
Daily (15-min checks), weekly (1-hour review), and monthly (3-hour audit) optimization procedures with specific decision rules for scaling, pausing, and troubleshooting
Cross-Platform Retargeting Orchestration
Coordinated retargeting across Meta, Pinterest, and YouTube — sequenced by user behavior (viewed → ATC → checkout → purchased) with platform-specific frequency caps
Ad-Specific Landing Page Strategy
7 landing page types matched to ad campaign intent — with conversion element optimization and Hotjar-based behavioral analysis
Performance Reporting Dashboard
12-section Looker Studio dashboard covering executive summary, platform breakdown, funnel analysis, creative/audience/product performance, attribution, budget tracking, and competitive insights
Seasonal Campaign Calendar & Templates
8 seasonal campaigns with pre-built structures, audience configurations, budget adjustments, and creative briefs — ready to activate each season
Scaling Framework
7 scaling methods (vertical, horizontal by audience/platform/placement/creative, offer scaling, geographic expansion) with specific triggers and risk levels
₹52,40,000 gross profit (after COGS, shipping, ad spend)
—
Ad Creatives Tested (Cumulative)
5 (never changed)
180+ (systematic testing)
—
Proven Winner Creatives in Library
0 (no testing)
42 (with performance data)
—
📋 Case Study Summary
Challenge: NestCraft Living — a D2C furniture and home decor brand with 240+ products and 4.5-star reviews — had spent ₹42L on paid social over 14 months with a 1.6x ROAS, losing money on every ad-acquired customer. Their “strategy” was boosting Instagram posts with no funnel structure, no retargeting, no dynamic product ads, no Pinterest or YouTube presence, 5 stale ad creatives running for 8 months, misconfigured conversion tracking, and no budget allocation framework. Competitors like Wakefit and Urban Ladder were scaling at 5–7x ROAS while NestCraft bled money.
Solution: We built a complete social media advertising system — overhauling conversion tracking (Meta Pixel, CAPI, Pinterest Tag, GTM, GA4, Triple Whale); creating an 18-audience architecture with custom, lookalike, interest, and platform-specific audiences; designing a 4-stage full-funnel campaign system (Awareness → Consideration → Conversion → Retention) across Meta (60%), Pinterest (25%), and YouTube (15%); producing 72 initial ad creatives including video, carousels, and dynamic product ads; implementing a monthly creative production and A/B testing system; building a campaign optimization playbook with daily/weekly/monthly procedures; orchestrating cross-platform retargeting with frequency caps; optimizing landing pages with Hotjar behavioral analysis; and creating a 12-section performance dashboard with seasonal campaign calendar and complete handover documentation.
Result: In 6 months, blended ROAS jumped from 1.6x to 6.8x. CPA dropped 76% (₹2,800 → ₹680). Overall CPA across all channels fell 62%. Monthly ad-attributed revenue grew 608% (₹4.8L → ₹34L). Total 6-month ad-attributed revenue reached ₹1.84Cr. Meta ROAS hit 7.2x, Pinterest contributed ₹7.25L/month at 5.8x ROAS, and YouTube added ₹3.15L/month. BOFU retargeting alone achieved 12.4x ROAS. Video ad CTR was 417% higher than previous static ads. The ad channel went from losing money to generating ₹52.4L gross profit. NestCraft’s paid social transformed from their weakest channel into their primary scalable revenue driver.
Tired of Burning Money on Ads That Don’t Convert?
We build social media advertising systems that turn your ad spend into a predictable, scalable revenue engine — with full-funnel architecture, multi-platform campaigns, dynamic product ads, conversion tracking, and optimization playbooks that make every CENT work harder.
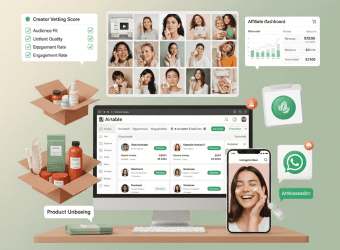
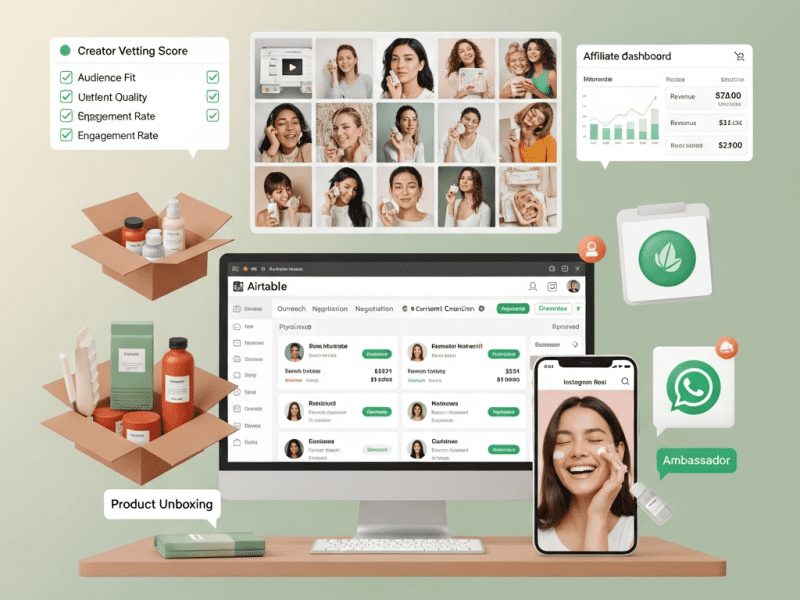
We designed and launched a complete influencer and UGC coordination program for PureRoots Naturals — building a network of 180+ vetted creators, generating 420+ authentic content pieces in 6 months, reducing customer acquisition cost by 54%, and turning real customers into the brand’s most powerful marketing channel.
Influencer Strategy & Tier Framework, Influencer Discovery & Vetting System, UGC Program Design & Creator Onboarding, Campaign Brief & Guidelines Development, Influencer CRM & Relationship Management, Content Rights & Licensing Framework, UGC Collection & Curation Pipeline, Influencer Content Amplification Strategy, Performance Tracking & ROI Attribution, Brand Ambassador Program Design
Tools & Platforms Used
Notion, Airtable, Modash, HypeAuditor, Instagram, TikTok, YouTube, Google Sheets, Canva Pro, Google Drive, Zapier, Slack, Later (scheduling), Shopify (affiliate tracking), UpPromote (affiliate/ambassador), ChatGPT API (OpenAI), Typeform, Loom, WhatsApp Business, Gmail (outreach sequences)
Project Year
2025
The Overview
PureRoots Naturals is a D2C Ayurvedic skincare brand, offering a curated range of 18 products — from kumkumadi face serums and turmeric body scrubs to neem-tulsi cleansers and saffron night creams. Every product uses clinically-tested Ayurvedic formulations, sustainably sourced ingredients, and eco-friendly packaging. Their products are genuinely excellent — 4.6-star average across 3,200+ reviews on their Shopify store.
But PureRoots had a visibility problem. In India’s hyper-competitive D2C skincare space — where Mamaearth, mCaffeine, Plum, and Dot & Key spend crores on influencer partnerships — PureRoots was invisible. Their products were better than half the “viral” brands on Instagram, but nobody was talking about them. No unboxing videos. No “get ready with me” features. No dermatologist reviews. No before-and-after transformations.
They’d attempted influencer marketing twice. The first time, they sent free products to 50 Instagram accounts with over 100K followers. Result: 4 posted (out of 50), the posts looked like ads, engagement was terrible, and they couldn’t track a single sale. The second time, they paid ₹2.5 lakh to a single macro-influencer with 800K followers. The Reel got 45K views but generated exactly 11 website visits and 0 orders. Total ROI: negative ₹2.5 lakh.
PureRoots was doing what most brands do — treating influencer marketing as “send products and pray” or “pay one big influencer and hope it works.” Both approaches are fundamentally flawed. Influencer marketing is a system, not a gamble. UGC is a pipeline, not an accident.
We built a complete influencer and UGC coordination program — from tiered influencer strategy and creator vetting to campaign briefs, content rights management, UGC collection pipelines, brand ambassador programs, and ROI attribution — transforming PureRoots from invisible to omnipresent in India’s skincare conversation, powered by authentic voices, not ad spend.
The Challenge
Zero Influencer Strategy: No framework for which influencers to partner with, what content to request, how to brief creators, or how to measure success. “Influencer marketing” meant randomly DM-ing large accounts asking if they’d post for free products. No tiering, no personas, no goals per tier.
Failed Influencer Attempts with No ROI:
Past Attempt
Investment
Result
Problem
Free Product Seeding (50 influencers)
₹1.2L (products + shipping)
4 posted (8% post rate), generic content, no trackable sales
No vetting, no brief, no follow-up, no relationship building — just “spray and pray”
Macro-Influencer Paid Post
₹2.5L (single Reel)
45K views, 11 website visits, 0 orders
Audience mismatch (fashion influencer, not skincare), scripted content felt inauthentic, no CTA optimization, no affiliate tracking
TOTAL
₹3.7L invested
~0 measurable revenue
No strategy, no system, no measurement
No UGC Pipeline: PureRoots had 3,200+ customers who loved their products (4.6-star average), but no system to encourage, collect, curate, or repurpose their content. Customer reviews existed as text on Shopify — never turned into social proof, never featured on Instagram, never used in ads. The most powerful marketing asset — real customer voices — was being completely wasted.
Content Authenticity Gap: PureRoots’ own branded content looked polished but “salesy.” In skincare, consumers trust real people using products far more than brand-produced glamour shots. 92% of consumers trust UGC over branded content (Stackla study). PureRoots had zero authentic creator content in their marketing mix.
No Content Rights Management: Even the few influencer posts that did go live couldn’t be repurposed — PureRoots had no usage rights agreements, so they couldn’t legally use influencer content in ads, on their website, or in email marketing. Valuable content was locked to the creator’s feed.
Competitor Influencer Dominance:
Competitor
Monthly Influencer Collabs
UGC Volume
Ambassador Program
PureRoots Gap
Mamaearth
200+ influencer posts/month
Massive organic UGC
500+ ambassadors
PureRoots: 0 monthly influencer posts
mCaffeine
150+ influencer posts/month
Strong unboxing culture
Active affiliate program
PureRoots: No affiliate system
Plum Goodness
80+ influencer posts/month
High skincare routine UGC
Micro-influencer network
PureRoots: No creator network
Dot & Key
60+ influencer posts/month
Growing TikTok presence
Dermatologist partnerships
PureRoots: No expert partnerships
No Creator Relationship Management: No CRM for tracking influencer relationships, conversation history, content deliverables, payment status, or performance history. Everything lived in random DMs and email threads. Couldn’t tell who’d been contacted, who’d agreed, who’d delivered, or who performed well.
How do their sponsored posts look? Authentic or obviously forced? Professional or sloppy?
Review tagged brand collaborations
TOTAL
100 pts
Minimum score to proceed: 65/100 (Tier 1–2), 75/100 (Tier 3–4)
Airtable scorecard
Outreach System & Sequences:
Outreach Stage
Channel
Message Framework
Timing
Stage 1 — Warm-Up
Instagram (follow + engage with 3–5 of their posts over 1 week)
Genuine comments on their content — not “love this!” but thoughtful, specific engagement
7 days before outreach
Stage 2 — Initial DM
Instagram DM or Email
Personalized message: Reference specific content of theirs → Introduce PureRoots → Express why they’d be a great fit → Soft ask: “Would you be open to exploring a collaboration?”
Day 8
Stage 3 — Follow-Up
Same channel as Stage 2
Friendly follow-up: “Just wanted to bump this in case it got buried — would love to chat!”
Day 12 (if no response)
Stage 4 — Value-Add Follow-Up
Email (if DM unsuccessful)
Send a small value — “I saw your post about [topic], thought you might find this Ayurvedic skincare guide interesting” + reiterate collaboration interest
Day 18 (if still no response)
Stage 5 — Final Touch
Instagram DM
Brief, no-pressure: “Totally understand if the timing isn’t right! Our door is always open. Wishing you the best with your content 🌿”
POST-PURCHASE UGC EMAIL SEQUENCE
━━━━━━━━━━━━━━━━━━━━━━━━━━━━━━━━

EMAIL 1 — Day 3 (Post-Delivery):
  Subject: "Your PureRoots ritual begins 🌿"
  Content: Welcome + how to use your product + link to tutorial video
  CTA: None (value only — don't ask for anything yet)

EMAIL 2 — Day 10 (Early Results):
  Subject: "Noticing a difference yet? ✨"
  Content: "By now, your skin is absorbing the goodness..."
  + Link to other customers' before/after stories
  CTA: Soft — "We'd love to hear how it's going! Reply to this email."

EMAIL 3 — Day 14 (UGC Ask):
  Subject: "Share your glow, earn rewards 📸"
  Content: "Your skin story matters! Share a photo or video of your
  PureRoots routine and earn 200 loyalty points (₹200 value)."
  CTA: "Upload your content here" → Typeform with photo/video upload
  + "Or post on Instagram with #PureRootsGlow and tag @pureroots"

EMAIL 4 — Day 21 (Review Ask):
  Subject: "Quick question about your experience"
  Content: Direct ask for product review on website
  CTA: "Leave a review" → Shopify product review page

EMAIL 5 — Day 30 (Testimonial Ask — for high-rating reviewers):
  Subject: "Would you share your story on video? 🎥"
  Content: "Your review was amazing! Would you be open to recording a
  quick 30-second video testimonial? We'll feature you on our page
  + send you a surprise gift!"
  CTA: "Yes, I'm in!" → Loom recording link or WhatsApp video submission

AUTOMATION: Zapier triggers based on Shopify order status + timing
━━━━━━━━━━━━━━━━━━━━━━━━━━━━━━━━━━━━━━━━━━━━━━━━━━━━━━━━━━━━━━━━━━
UGC Packaging Insert Design:
Included in every order — a beautiful, on-brand card:
Element
Details
Front
“Your glow deserves to be seen 🌿” — warm, inviting design with brand colors
Back — Instructions
“Share your PureRoots moment: 1️⃣ Snap a photo or record a short video 2️⃣ Tag @pureroots + #PureRootsGlow 3️⃣ Earn 200 loyalty points + chance to be featured!”
QR Code
Links to Typeform UGC submission form (for customers not on Instagram)
“CREATOR-NAME15” — 15% discount for their audience, tracked via UpPromote for commission attribution
Content Submission Instructions
Loom video walkthrough (3 min)
How to upload content drafts to Google Drive for approval before posting (Tier 3–4 only), how to submit final links
FAQ Document
PDF (2 pages)
Common questions: shipping timeline, content revision policy, payment terms, usage rights summary, who to contact for help
Campaign Brief Template (Detailed):
Brief Section
Details Provided
Campaign Name
e.g., “7-Day Glow Challenge — Kumkumadi Serum”
Campaign Objective
Drive awareness + conversions for Kumkumadi Face Serum through authentic 7-day usage documentation
Key Messages (NOT Scripts)
3–4 talking points: “Made with real saffron & kumkumadi tailam,” “Visible glow in 7 days,” “Ayurvedic formulation backed by clinical testing,” “Lightweight, non-greasy, works for Indian skin” — creators express these in their own words
Content Deliverables
1 Instagram Reel (60–90 sec, 7-day journey or before/after), 3 Instagram Stories (Day 1, Day 4, Day 7 check-ins), 1 TikTok (15–30 sec, before/after or “watch my skin transform”)
Content Do’s
✅ Use the product genuinely for 7 days before creating final content. ✅ Show real skin — no heavy filters or beauty mode. ✅ Be honest — mention what you genuinely liked. ✅ Good natural lighting. ✅ Show the product packaging clearly at least once. ✅ Include your unique discount code in caption.
Content Don’ts
❌ No scripted or robotic-sounding endorsements. ❌ No claims we haven’t approved (“cures acne” etc.). ❌ No heavy filters that alter skin appearance. ❌ Don’t tag competitor brands. ❌ Don’t use copyrighted music. ❌ Don’t post without approval (Tier 3–4).
Content Examples
Links to 5 example videos showing desired style — authentic, well-lit, genuine reaction, casual but polished
Timeline
Products shipped: [Date] → Usage period: 7 days → Draft submission: [Date] → Feedback/approval: 48 hours → Post by: [Date] → Stories: Days 1, 4, 7
Specific, constructive feedback sent via preferred channel — “Love the opening! Could you adjust the lighting on the product close-up? And add your discount code to the caption?”
Within 24 hours of submission
Slack DM / WhatsApp / Email
Approval
Confirmed “approved to post” with suggested posting time based on audience analytics
Within 48 hours of submission
Slack confirmation + Airtable status update
Publication Confirmation
Creator posts → sends link → content manager verifies live post matches approved draft
Within posting window
Creator sends link → Airtable log
Asset Collection
High-resolution content files downloaded and added to UGC asset library
Within 24 hours of posting
Google Drive — organized by creator, campaign, content type
Note: Tier 1 (Nano) and Tier 5 (Ambassadors) post directly without pre-approval — brief is trusted. Tier 2 requires review for first 2 collaborations, then trusted. Tier 3–4 always requires pre-approval.
All rights documented in simple, clear collaboration agreement (not a 20-page legal document — a 2-page, plain-language agreement via Typeform signature).
UGC Curation & Repurposing System:
UGC Use Case
How Content Is Repurposed
Platform/Channel
Monthly Volume
Social Proof Repost
Creator’s Reel/post reposted on PureRoots’ Instagram/TikTok with credit tag and branded frame
Instagram Feed, TikTok, Facebook
15–20 reposts/month
Story Features
Creator content shared to PureRoots’ Instagram Stories with “See what @creator says about our Kumkumadi Serum!” overlay
Instagram Stories
25–30 stories/month
UGC Ad Creatives
Best-performing creator content turned into paid ad creatives — “real customers, real results” format
Meta Ads, TikTok Ads
8–12 ad creatives/month
Website Testimonials
Video testimonials and photo reviews embedded on product pages and dedicated “Real Results” page
Shopify product pages, /results page
Evergreen — updated monthly
Email Marketing
UGC photos and quotes included in email campaigns — “See what [Name] says about this product”
Klaviyo email campaigns
4–6 emails/month featuring UGC
Product Page Social Proof
Instagram feed embed on product pages showing real customer photos using that specific product
Shopify product pages
Evergreen embed — auto-updates
Compilation Reels
Monthly “Best of UGC” compilation — 10–15 clips from different creators edited into one showcase Reel
Instagram Reels, TikTok, YouTube Shorts
2 compilations/month
Pitch & PR Deck
Best UGC included in investor/retail pitch deck — “our customers are our best marketers”
PDF/presentation
Updated quarterly
Content Amplification Strategy:
Amplification Method
Process
Budget Allocation
Organic Reposting
Best creator content reposted on PureRoots’ channels with credit — extends reach to brand’s audience
₹0 (organic)
Paid Whitelisting (Spark Ads / Partnership Ads)
Top-performing creator content boosted as paid ads directly from the creator’s handle — appears as native content, not brand ad
40% of monthly influencer ad budget
Dark Posting
Creator content used as ad creative under PureRoots’ ad account — reaches beyond creator’s audience with brand targeting
35% of monthly influencer ad budget
Creator Collaboration Post
Instagram “Collab” feature — post appears on both brand and creator’s feed simultaneously
₹0 (organic)
Story Reshare Chain
When creator posts → PureRoots reshares to Stories → Other creators reshare PureRoots’ reshare → Snowball effect
₹0 (organic)
Best-Performer Retainer
Creators whose content performs exceptionally well get offered ongoing monthly retainer — guaranteed continued high-performing content
25% of monthly influencer ad budget
Influencer Content Performance Benchmarks:
Metric
Tier 1 (Nano) Target
Tier 2 (Micro) Target
Tier 3 (Mid) Target
Tier 4 (Macro) Target
Engagement Rate
6%+
4%+
3%+
2%+
View-Through Rate (Reels)
40%+
35%+
25%+
20%+
Click-Through (Affiliate Link)
2%+
1.5%+
1%+
0.8%+
Conversion Rate (Link → Sale)
4%+
3%+
2%+
1.5%+
Cost Per Acquisition
<₹250
<₹400
<₹600
<₹1,000
Content Quality Score (1–10)
6+
7+
8+
9+
Response to Reuse in Ads
CTR 2%+ when used as ad creative
CTR 2.5%+
CTR 3%+
CTR 3.5%+
Phase 5: Brand Ambassador Program & Performance System (Week 5–6)
Brand Ambassador Program — “PureRoots Glow Collective”:
Program Element
Details
Program Name
PureRoots Glow Collective
Selection Criteria
Existing collaborators who: scored 80+ on vetting, delivered 2+ successful campaigns, demonstrated genuine brand affinity, audience engagement above tier average
Application Process
Invite-only (from top performers) or application via website (evaluated against criteria)
Monthly product box (₹2,500 value — new launches + favorites), 15% affiliate commission on all sales via unique code, early access to new products (2 weeks before public launch), exclusive “Glow Collective” community access (WhatsApp group + quarterly virtual meetup), annual “PureRoots Creator Retreat” (top 10 performers), featured on PureRoots website “Our Creators” page
Tracking
UpPromote — unique affiliate link + discount code per ambassador, monthly dashboard showing: clicks, orders, revenue, commission earned
Content Guidelines
Lighter than campaign briefs — ambassadors know the brand, follow general guidelines, post authentic content. No pre-approval required. Monthly theme suggestions (not mandates).
Ambassadors who don’t meet minimum content commitment for 2 consecutive months are gently transitioned out with appreciation — “doors always open” messaging
Monthly Influencer & UGC Performance Dashboard (Airtable + Google Sheets):
Dashboard Section
Metrics Tracked
Review Frequency
Campaign Overview
Active campaigns, total creators engaged, content pieces delivered vs. target, budget spent vs. allocated
Total UGC pieces collected (cumulative), pieces by type (photo/video/review), pieces by source (organic/prompted/creator/ambassador)
Monthly
Revenue Attribution
Total revenue from influencer affiliate codes, total revenue from UGC-based ads, blended CPA across all influencer tiers, ROAS (Return on Ad Spend) for UGC ad creatives
Monthly
Pipeline Health
Creator pipeline: discovery → outreach → confirmed → content received (conversion rates at each stage), response rates, average time from outreach to content live
Monthly
Platform Performance
Best-performing platform for influencer content (Instagram vs. TikTok vs. YouTube), best content format, best posting time
Monthly
Ambassador Program
Active ambassadors, monthly content delivery rate, total affiliate revenue, top 5 ambassadors, churn rate
Monthly
Content Repurposing ROI
UGC pieces repurposed as ads — CPA comparison vs. brand-produced ad creatives, CTR comparison, conversion comparison
Monthly
Relationship Health
Creator satisfaction (quarterly survey), average response time to creators, repeat collaboration rate, ambassador retention rate
Quarterly
Influencer Relationship Nurturing System:
Touchpoint
Frequency
Action
Purpose
Post-Campaign Thank You
After every campaign
Personalized thank you message + highlight of what we loved about their content
Tier 3–4 creators cannot post competitor skincare content during exclusivity period
Documented in collaboration agreement, monitored during exclusivity window
Data Privacy
Creator personal information (email, phone, address) stored securely, not shared with third parties
Airtable access restricted, data handling policy shared with creators
Key Features Delivered
Feature
Description
5-Tier Influencer Framework
Nano, Micro, Mid-Tier, Macro/Expert, and Brand Ambassador tiers — each with defined roles, compensation models, content expectations, and volume targets
Creator Vetting Scorecard
100-point evaluation system covering engagement rate, audience authenticity, content quality, demographic match, niche relevance, brand safety, posting consistency, and collaboration history
Multi-Channel Discovery System
6 discovery channels — hashtag mining, competitor analysis, platform tools (Modash/HypeAuditor), customer mining, inbound applications, and community monitoring
Detailed yet creator-friendly briefs with talking points (not scripts), content dos/don’ts, visual examples, timeline, compensation details, and usage rights
Content Rights Framework
Tiered usage rights covering reposting, paid ads, website, email, and print — documented in plain-language 2-page agreements, not intimidating legal contracts
UGC Repurposing System
8 repurposing channels: social repost, Story features, ad creatives, website testimonials, email marketing, product page embeds, compilation Reels, and pitch decks
Content Amplification Strategy
Organic reposting, paid whitelisting (Spark/Partnership Ads), dark posting, collab posts, and reshare chains — maximizing reach for every piece of creator content
Brand Ambassador Program
“PureRoots Glow Collective” — 25–30 invite-only ambassadors with monthly product boxes, 15% affiliate commission, early access, recognition tiers, and annual Creator Retreat
UGC ads: 3.2% CTR vs. Brand ads: 1.4% CTR (128% higher)
⬆ 128%
UGC Ad Creative CPA vs. Brand-Produced Ads
No UGC ads existed
UGC ads: ₹280 CPA vs. Brand ads: ₹620 CPA (55% lower)
⬇ 55%
Ambassador Program Revenue
₹0
₹4.2L/month (from 28 ambassadors)
—
Brand Mentions (Monthly, Organic)
~30
380+
⬆ 1,167%
Website Traffic from Influencer Content
~200 visits/month (untracked)
8,400 visits/month (UTM tracked)
⬆ 4,100%
Repeat Collaboration Rate
0%
72% (creators who do 2+ campaigns)
—
Creator Satisfaction Score
N/A
9.1/10 (quarterly survey)
—
📋 Case Study Summary
Challenge: PureRoots Naturals — a D2C Ayurvedic skincare brand with genuinely excellent products (4.6-star average, 3,200+ reviews) — was invisible in India’s influencer-dominated skincare market. Two previous influencer attempts failed catastrophically: a 50-creator product seeding yielded only 4 posts (8% post rate), and a ₹2.5L macro-influencer campaign generated 0 orders. No UGC collection system existed despite 3,200+ happy customers. Competitors like Mamaearth and mCaffeine dominated social proof with 200+ influencer posts monthly while PureRoots had zero.
Solution: We built a complete influencer and UGC coordination program — a 5-tier influencer framework (Nano to Ambassador) with a 100-point creator vetting scorecard; a 6-channel discovery system; a warm 5-stage outreach sequence; an Airtable influencer CRM; a 4-stream UGC collection pipeline with post-purchase automation; professional creator onboarding kits with campaign briefs; a content rights and licensing framework; an 8-channel UGC repurposing system; a content amplification strategy including whitelisted paid ads; a “Glow Collective” brand ambassador program with tiered recognition and 15% affiliate commissions; a 9-section performance dashboard; a relationship nurturing system with 8 touchpoints; and full ASCI-compliant legal and disclosure framework.
Result: PureRoots built a network of 180+ active creators generating 420+ content pieces monthly. Influencer-attributed revenue reached ₹21L+/month. Overall customer acquisition cost dropped 54% (from ₹780 to ₹360). UGC ad creatives achieved 128% higher CTR and 55% lower CPA than brand-produced ads. Instagram grew 181% and TikTok grew 984%. The ambassador program alone generated ₹4.2L/month. Brand mentions increased 1,167%. Creator satisfaction scored 9.1/10 with a 72% repeat collaboration rate.
Your Best Marketing Team? Your Customers and Creators.
We build influencer and UGC coordination programs that turn authentic creator voices into your most powerful marketing channel — with vetting systems, campaign frameworks, content pipelines, ambassador programs, and ROI tracking that make every rupee work harder than paid ads ever could.
We built a complete social media content creation and design system for MapleLeaf Café Chain — producing 180+ branded content pieces monthly across 5 platforms, increasing engagement by 248%, and establishing a visual identity so consistent that followers recognize a MapleLeaf post before reading the caption.
Content Strategy & Pillar Development, Visual Brand System for Social, Photo & Video Content Direction, Reels/Shorts Production Framework, Carousel & Infographic Design, Story & Ephemeral Content System, Content Template Library, Multi-Platform Adaptation, Content Production Workflow
Tools & Platforms Used
Canva Pro, CapCut Pro, Adobe Lightroom (presets), ChatGPT API (OpenAI), Notion, Airtable, Later (scheduling), Instagram, TikTok, Facebook, YouTube, Pinterest, Google Drive, Zapier, Slack, Midjourney (lifestyle imagery), Eleven Labs (voiceover)
Project Year
2025
The Overview
MapleLeaf Café is a specialty coffee and artisan bakery chain with 8 locations across Bangalore and Chennai. Known for their single-origin pour-over coffees, sourdough pastries, and Instagram-worthy interiors, they had all the ingredients for social media success — beautiful spaces, photogenic products, and a passionate customer base. But their social content didn’t reflect any of it.
Their Instagram feed was a chaotic mix of poorly-lit phone photos, inconsistent filters, random font choices, and graphics that looked like they were made in PowerPoint. One post would be warm-toned and moody, the next would be neon-bright with clip art. Their TikTok was empty. Their Pinterest was dormant. Their Facebook was a graveyard of auto-shared Instagram posts with cropped images and broken formatting.
Despite having the most photogenic product in the food industry — beautifully crafted coffee and pastries — MapleLeaf’s social media made their offerings look generic. Competitors with inferior products but superior content were stealing the spotlight, getting the tags, earning the UGC, and becoming the “must-visit” cafés in Bangalore’s crowded specialty coffee scene.
We designed and implemented a complete social media content creation and design system — from visual brand identity and content pillars to production workflows, template libraries, and multi-platform adaptation — giving MapleLeaf a distinctive, professional, instantly-recognizable social presence that matches the premium quality of their actual café experience.
The Challenge
Zero Visual Consistency: 12 months of Instagram posts looked like they came from 12 different brands. No consistent color palette, typography, photo editing style, or graphic design framework. Every post was created ad-hoc with whatever felt right in the moment.
Amateur Content Quality: Product photos were taken on phones in varying lighting conditions with no composition guidelines. Food photography — an art form that directly drives café visits — was being treated as an afterthought. Latte art that deserved a professional close-up was photographed from 3 feet away with fluorescent ceiling lights.
No Content Strategy: Posts were reactive — “we need to post something today, what should we do?” No content pillars, no editorial calendar, no thematic consistency, no funnel alignment. Content served no strategic purpose beyond “being present.”
Single Platform Focus: 95% of content effort went to Instagram Feed, with Stories, Reels, TikTok, Pinterest, and YouTube completely neglected. Each platform has unique strengths and audiences — MapleLeaf was leveraging only one, and poorly.
No Scalable Production System: Each piece of content was a one-off creation from scratch. No templates, no asset libraries, no brand guidelines for social, no batch production process. Creating 5 posts took as long as creating 50 should.
Staff-Created Content Inconsistency: Different café locations had staff posting independently — each with their own style, quality standards, and posting frequency. The Anna Nagar location’s content looked nothing like the Koramangala location’s, despite being the same brand.
Competitor Content Gap:
Competitor
IG Followers
Avg Engagement
Content Quality
MapleLeaf Gap
Third Wave Coffee
142K
4.8%
Professional photography, strong Reels, consistent brand
MapleLeaf looks amateur in comparison
Blue Tokai
186K
5.2%
Educational coffee content, UGC program, stunning visuals
Monsoon, Diwali, Christmas, Summer, Valentine’s — seasonal themes overlaid on brand system
All templates use locked brand elements (logo placement, colors, fonts) — staff can only change content (photos, text) without breaking brand consistency.
Photo & Video Asset Library:
Organized Google Drive library with 2,000+ assets:
Asset Category
Contents
Organization
Product Photography
Professional shots of every menu item (3-5 angles each), organized by category (coffee, pastry, food, drinks)
By product category → By item name
Interior/Ambience
Each location photographed (15-20 shots per café: exterior, interior zones, details, golden hour, evening)
By location → By zone
People
Barista portraits, team photos, customer moments (with consent), event photos
By location → By person/event
Process/Behind-Scenes
Coffee brewing methods, baking process, roasting, latte art creation — photo + video
By process type
Lifestyle/Mood
Flatlay coffee scenes, reading with coffee, rain-day windows, work-from-café setups
By mood/theme
Brand Elements
Logo files (all formats), icon set, pattern files, texture overlays, color swatches, font files
“Day in the life of a MapleLeaf barista” or customer testimonial
30-60 sec
Phone interview style, candid feel, warm editing
4 videos
Café Ambience
Aesthetic café shots set to lo-fi music — the “virtual visit”
15-30 sec
Cinematic B-roll compilation, smooth transitions, no talking
6 videos
Menu Reveal
New item launch with dramatic reveal, taste reaction, ingredients
15-30 sec
Close-up product shots, reaction clips, text overlay
4 videos
Total Video Production: 36 videos/month across Reels and TikTok
Video Production Batch Workflow:
BATCH VIDEO PRODUCTION DAY (Bi-Weekly) ━━━━━━━━━━━━━━━━━━━━━━━━━━━━━━━━━━━━━
PREP (1 hour): → Review content calendar for next 2 weeks → List all videos needed (typically 18) → Prepare shot lists for each video → Charge equipment, prepare products/setups
SHOOT (3 hours at café — during slow period): → Process videos: Set up tripod, film 6-8 processes → Product shots: Film new menu items, seasonal specials → Ambience B-roll: Capture golden hour, interior details → Staff content: Quick interviews, day-in-life clips → Customer content: Ask willing customers for quick testimonials
EDIT (4 hours — can be done remotely): → Import footage to CapCut Pro → Apply brand color grading preset → Add text overlays using brand fonts → Add music from approved library → Export in platform-specific formats → Create thumbnail using Canva template
TOTAL: 8 hours of production → 18 videos COST PER VIDEO: ~$12 (time + tools) COMPARED TO: $200-500 per video from freelance videographer
MONTH PLANNING (Day 1 of previous month): → Review past month performance (top/bottom content) → Identify upcoming events, holidays, seasons, promotions → Map content to 5 pillars (ensure balance) → Assign content to weekly themes → Create monthly calendar in Notion
WEEKLY PLANNING (Every Friday): → Finalize next week's content from monthly calendar → Assign to team members (photographer, designer, writer) → Brief each piece: concept, format, platform, caption direction
PRODUCTION (Monday-Wednesday): → Photography/video batch shoots → Carousel/graphic design in Canva → Caption writing (ChatGPT draft → human polish) → Content adaptation for all platforms
SCHEDULING (Thursday): → All content for next week loaded into Later → Preview grid for Instagram aesthetic check → Story schedule set with interactive elements → Captions reviewed, hashtags added, tags confirmed → Approved → Auto-publish activated
MONITORING (Daily): → Engage with comments within 1 hour of posting → Track early performance signals → Amplify winners (boost or reshare to Stories) → Note learnings for next cycle ━━━━━━━━━━━━━━━━━━━━━━━━━━━━━━━━━━━━━━━━━━━━━━
Phase 5: Location-Specific Content, Training & Performance System (Week 5)
Multi-Location Content Strategy:
Content Level
What
Who Creates
Frequency
Brand-Level
Educational carousels, brand campaigns, seasonal content, process videos
Central marketing team
60% of content
Location-Level
Daily specials, local events, barista spotlights, “today at [location]” Stories
Trained café staff using templates
30% of content
UGC/Community
Customer features, reshared UGC, reviews, community moments
Community manager curates
10% of content
Staff Content Creation Training:
Trained 8 “Content Champions” (one per location) in:
Training Module
Duration
Topics Covered
Brand Guidelines 101
1 hour
Color palette, fonts, photo style, tone of voice, do’s and don’ts
Color palette, typography, photo editing presets, graphic style, video direction, icon set — ensuring every piece of content is instantly recognizable as MapleLeaf
5-Pillar Content Strategy
Product Showcase, Coffee Education, Café Vibes, Community & People, Promotional — balanced mix driving engagement, education, and sales
85 Canva Template Library
Reusable, brand-locked templates across 11 categories for every content need — anyone can create on-brand content in minutes
Photo & Video Asset Library
2,000+ organized, searchable assets with Lightroom presets, music library, and sound effects
36-Video Monthly Production System
Bi-weekly batch shooting workflow producing 18 videos per session at $12/video — covering Reels, TikToks, and Shorts
14 Monthly Carousel Production
6 carousel frameworks with brand templates for educational, feature, and engagement content
Multi-Platform Adaptation System
Each hero piece generates 3-6 platform-optimized versions — maximizing content ROI across Instagram, TikTok, Facebook, YouTube, and Pinterest
266+ Monthly Content Pieces
Full content volume across all 5 platforms — from a streamlined, efficient production system
Multi-Location Content Program
8 trained “Content Champions” producing location-specific daily content using templates and brand guidelines
Content Calendar & Scheduling
Monthly planning → weekly production → Thursday scheduling workflow with approval gates and quality checks
Photography & Videography Direction Guide
Shot-by-shot guidance for every content type — camera angle, lighting, composition, and mood specifications
Performance Tracking System
Per-post tracking across engagement, saves, shares, clicks, and revenue — with pillar, format, and location-level analysis
Challenge: MapleLeaf Café’s social media was a chaotic mess — poorly-lit phone photos, inconsistent branding, no templates, no video content, zero TikTok/Pinterest presence, and just 40-50 random posts monthly across platforms. Despite having beautifully photogenic products and spaces, their social presence made them look amateur while competitors with inferior products dominated through superior content.
Solution: We built a complete content creation and design system — a visual brand identity with color palette, typography, and Lightroom presets; an 85-template Canva library; a 2,000+ asset library; a bi-weekly batch video production workflow producing 36 videos/month at $12 each; 14 monthly carousels from 6 frameworks; multi-platform adaptation turning each piece into 3-6 versions; a multi-location content program training 8 staff “Content Champions”; and a monthly planning → weekly production → scheduling workflow with performance tracking.
Result: Content output grew from 50 to 266+ monthly pieces. Instagram engagement jumped 250%. TikTok grew from 2,100 to 28,400 followers. Save rate increased 833%. Social-driven online orders grew 675%. Content production time dropped 75% per piece. Video cost dropped from $300+ to $12 each. Brand visual consistency scored 9.2/10 (from 2/10). MapleLeaf is now visually indistinguishable from premium international coffee brands.
Your Product Is Beautiful. Does Your Social Media Show It?
We build content creation systems that give your brand a distinctive, professional, instantly-recognizable social presence — with visual identity, template libraries, production workflows, and multi-platform adaptation that makes creating stunning content fast, affordable, and scalable.
We built a strategic community management system for FitVerse Fitness App — transforming scattered, reactive social interactions into an organized engagement engine that increased community-driven app downloads by 156%, boosted brand sentiment to 94% positive, and turned 2,400 customers into active brand advocates.
Community Strategy Development, Engagement Framework Design, Comment & DM Management System, Crisis & Reputation Management Protocol, User-Generated Content Pipeline, Community Growth Programs, Sentiment Monitoring, Community Health Dashboard
Tools & Platforms Used
Sprout Social, Agorapulse, Brand24, Instagram, Facebook Groups, TikTok, YouTube, Twitter/X, Discord, Slack, Zapier, Make (Integromat), ChatGPT API (OpenAI), Google Sheets, Airtable, Notion, Canva, Google Looker Studio, WordPress
Project Year
2025
The Overview
FitVerse is a subscription fitness app offering AI-personalized workout plans, nutrition tracking, and live group classes. With 34,000 app users, a $14.99/month subscription, and a social presence across Instagram (62K), TikTok (38K), Facebook Group (8,400 members), YouTube (14K), Twitter/X (9K), and a newly launched Discord server (1,200 members), they had built a sizable audience — but were failing to turn that audience into a community.
Comments went unanswered for days. DMs piled up in an unmanaged inbox. Negative reviews spread without response. Their Facebook Group was overrun with spam. Their Discord was a ghost town. User-generated content — transformation photos, workout videos, app screenshots — was being posted by customers but never acknowledged, reshared, or leveraged. Brand mentions went unmonitored. And there was zero system for identifying and nurturing their most passionate fans into brand advocates.
The difference between an “audience” and a “community” is engagement, belonging, and reciprocity. FitVerse had an audience. We built them a community.
The Challenge
Response Time Crisis: Average response time to comments: 38 hours. DMs: 52 hours. 43% of comments and 61% of DMs received no response at all. In the fitness industry — where motivation, accountability, and emotional support drive purchase decisions — silence feels like rejection.
Unmanaged Negative Sentiment: Negative comments and reviews were left unanswered, creating a visible trail of unresolved complaints. A single unanswered negative comment on a popular post could be seen by 10,000+ people — silently eroding trust.
Facebook Group Chaos: The 8,400-member Facebook Group had devolved into:
Zero community manager presence (last admin post was 4 months ago)
Members asking questions with zero responses from the brand
Valuable transformation stories buried under spam
Discord Ghost Town: Launched 3 months ago with initial excitement, but no ongoing management. Daily active users had dropped from 180 to 22. No conversation prompts, no structured channels, no events, no reason to return.
UGC Gold Mine Untapped: Customers were posting transformation photos, workout clips, and app screenshots on their personal accounts — tagging FitVerse or using #FitVerseResults. Approximately 120-150 UGC posts per month were going unnoticed, unacknowledged, and unused. Each piece was free, authentic, high-converting marketing content being completely wasted.
No Brand Advocate Program: FitVerse’s most passionate users — people who had genuinely transformed their lives with the app — had no formal recognition, no program to join, no incentive to spread the word, and no channel to feel special. These potential evangelists were being treated identically to a day-1 free trial user.
No Sentiment Monitoring: Nobody was tracking brand mentions, hashtag usage, review sentiment, or conversation themes across the internet. Problems could simmer on Reddit or Twitter for weeks before anyone at FitVerse noticed.
No Community Metrics: “Community health” was unmeasured. No tracking of response rates, sentiment trends, UGC volume, advocate activity, group engagement, or community-attributed conversions.
Our Approach & Strategy
Phase 1: Community Audit, Strategy & Voice Guidelines (Week 1)
Community Conversation Audit:
Analyzed 3 months of comments (4,800+), DMs (1,200+), Facebook Group posts (2,400+), reviews (340+), and brand mentions (680+)
Categorized every interaction:
Interaction Type
Volume (3 months)
% of Total
Current Response Rate
Priority
Positive feedback / praise
2,400
28%
12% responded
🟡 High (acknowledge!)
Product questions (how-to, features)
1,800
21%
34% responded
🔴 Critical (unanswered = lost user)
Transformation stories / results
680
8%
8% responded
🔴 Critical (UGC goldmine)
Customer support issues
940
11%
41% responded
🔴 Critical (churn risk)
Purchase/subscription inquiries
620
7%
28% responded
🔴 Critical (revenue loss)
Negative comments / complaints
480
6%
18% responded
🔴 Critical (reputation damage)
Spam / irrelevant
1,200
14%
N/A
Remove
Engagement bait (emoji, tags)
440
5%
4% responded
🟢 Low (batch respond)
Key Finding: 72% of direct product questions and purchase inquiries — the highest-intent interactions — were going unanswered. Each unanswered question represented a potential customer walking away.
Community Voice & Tone Guidelines:
Element
Guideline
Example
Personality
Encouraging coach, not corporate brand
“You’ve got this! 💪” not “Thank you for your inquiry.”
Tone Spectrum
Motivational ↔ Empathetic (adjusts to context)
Celebration: “INCREDIBLE transformation!! 🔥” / Support: “We totally hear you — let’s fix this together.”
Response Length
Match the energy — short comments get short replies, detailed questions get thorough answers
Quick: “Love this! 🙌” / Detailed: paragraph with steps + link
Emoji Usage
Moderate — 1-3 per response, fitness/wellness themed
💪🔥🏋️♀️✨🥗🎯 (approved set)
Never Say
“Per our policy,” “Unfortunately,” “We can’t”
Always reframe positively or offer alternatives
Escalation Language
Warm handoff, never defensive
“I’d love to get our support specialist to help — DMing you now so we can sort this out personally!”
Response Priority Framework:
Priority
Response Time Target
Interaction Types
🔴 P1 — Immediate
Under 1 hour
Negative reviews, complaint comments, support issues, purchase questions, crisis mentions
Keywords: “buy followers,” “check my profile,” “DM for collab,” MLM terms
Auto-hide, report, block repeat offenders
AI-Assisted Response System (ChatGPT):
Built AI response templates for high-volume interaction types:
AI RESPONSE WORKFLOW
━━━━━━━━━━━━━━━━━━━━

1. Comment/DM arrives in Agorapulse
2. Auto-tagged by category
3. AI generates draft response based on:
   → Comment content and sentiment
   → FitVerse brand voice guidelines
   → Category-specific response templates
   → Customer's profile (new user vs. long-term subscriber)
4. Community manager reviews draft (5-10 seconds)
5. Approves, edits slightly, or rewrites if needed
6. Publishes response

RESULT:
  Response quality: Consistent, on-brand, personalized
  Response speed: 80% faster than writing from scratch
  Community manager capacity: 3× more interactions handled/hour
━━━━━━━━━━━━━━━━━━━━━━━━━━━━━━━━━━━━━━━━━━━━━
Negative Comment & Review Response Protocol:
Scenario
Response Framework
Escalation
App bug/technical issue
Acknowledge → Apologize → Ask for details → Promise resolution → DM for follow-up
Slack alert to dev team with details
Billing complaint
Empathize → Explain → Offer resolution (refund/extension) → DM to process
Slack alert to billing team
Feature dissatisfaction
Validate frustration → Explain reasoning → Note as feedback → Share roadmap hint
“OH WOW [Name]!! 🔥🔥 This transformation is absolutely incredible — [specific detail from their post]. You put in the work and it SHOWS. Would you mind if we shared your story? You’re going to inspire so many people! 💪”
App question
“Great question, [Name]! 😊 You can [answer their specific question]. Here’s a quick guide that walks through it step by step → [link]. Let me know if you need anything else — we’re always here!”
Complaint
“Hey [Name], I’m really sorry you’re experiencing this — that’s not the experience we want for you. 😔 I’ve DMed you so we can get this sorted personally. We’ve got your back!”
Purchase inquiry
“Hey [Name]! Love the interest! 🎯 FitVerse gives you [key benefit 1], [key benefit 2], and [key benefit 3] — all personalized to YOUR goals. You can try it free for 7 days here → [link]. No credit card needed! Let me know if you have any questions!”
Phase 3: Facebook Group Revival & Discord Community Build (Week 3)
Facebook Group Transformation:
Element
Before
After
Rules & Guidelines
None
8 clear rules posted (no spam, no promotions, be supportive, content guidelines)
Moderation
None
3 trained moderators (1 staff + 2 volunteer power members) with removal authority
Spam Cleanup
35% of posts were spam
All spam removed + auto-moderation rules catching 90% of future spam
Most active Discord members invited to Brand Ambassador program
Phase 4: UGC Pipeline & Brand Advocate Program (Week 4)
UGC Collection & Management System:
UGC PIPELINE WORKFLOW
━━━━━━━━━━━━━━━━━━━━━

DISCOVERY (Automated):
  → Brand24 monitors: #FitVerse, #FitVerseResults, @FitVerse tags
  → Agorapulse captures tagged posts across IG, TikTok, Facebook
  → Daily digest delivered to community manager via Slack

ENGAGEMENT (Within 4 hours):
  → Like/react to the post
  → Leave enthusiastic, personalized comment
  → DM creator: "Love your [specific detail]! Would you mind
     if we featured your story on our page? 🌟"

PERMISSION (Automated + Manual):
  → If creator agrees → send UGC permission form (Typeform)
  → Form captures: full name, handle, permission level
     (social only / website / ads), preferred credit format
  → Signed → added to UGC library in Airtable

CURATION (Weekly):
  → Community manager reviews UGC library
  → Selects top 5-8 pieces for the coming week
  → Tags with: content type, platform suitability, quality score
  → Assigns to content calendar

PUBLISHING:
  → UGC shared on FitVerse channels with full credit
  → Creator tagged + thanked publicly
  → Creator receives "Featured Fan" badge + 1-month free premium
  → High-performing UGC flagged for paid ad use (with permission)

TRACKING:
  → Every UGC post tracked in Airtable with performance metrics
  → UGC vs. brand-produced content performance comparison
  → Revenue attributed to UGC content vs. other types
━━━━━━━━━━━━━━━━━━━━━━━━━━━━━━━━━━━━━━━━━━━━━━━━
UGC Volume Targets:
Source
Current Volume
6-Month Target
Tactic
Organic tags (unprompted)
~120/month
300/month
Better community engagement → more sharing
Prompted (app notification)
0
80/month
In-app “Share Your Results” prompt after milestones
Challenges/contests
0
60/month
Monthly transformation challenge with prizes
Ambassador program
0
40/month
50 ambassadors producing 3-4 pieces/month each
Total UGC Pipeline
~120/month
480/month
4× increase
Brand Ambassador Program — “FitVerse Champions”:
Element
Details
Selection Criteria
Active FitVerse user (3+ months), genuine transformation results, active social presence (1K+ followers), positive community contributions, applies and gets approved
Program Size
50 ambassadors (10 new per quarter, rolling program)
Benefits
Free premium subscription, exclusive merch, early feature access, monthly group call with founders, featured on FitVerse channels, ambassador badge on Discord, referral commission (20% of referred subscriptions for 3 months)
Requirements
3-4 social posts/month mentioning FitVerse, participate in monthly challenges, provide product feedback, attend quarterly virtual meetup
Application
Typeform application → scored by community manager → top applicants selected → onboarding call
😊 SENTIMENT: Overall: 94% positive (↑ from 89% Feb) Top positive themes: "love the new HIIT programs," "community is so supportive," "app keeps me accountable" Negative themes (6%): "subscription price" (2%), "Android bugs" (2%), "want more yoga content" (2%)
👥 COMMUNITY GROWTH: Facebook Group: 12,400 members (↑1,800), 52% monthly active Discord: 3,200 members (↑680), 180 DAU (↑ from 22 at launch!) Brand mentions: 1,420 this month (↑34%)
📸 UGC: UGC pieces discovered: 286 Permissions obtained: 184 Published on FitVerse channels: 32 UGC content engagement rate: 5.8% (vs. 3.2% brand content) Revenue attributed to UGC posts: $4,200
🎯 RECOMMENDATIONS: 1. UGC performing 81% better than brand content — increase UGC to 40% of content calendar 2. "Yoga content" is #1 feature request — flag for product team 3. Launch "Transformation Tuesday" Instagram series using top UGC (data shows Tuesday transformations get 2× saves) 4. Discord accountability partner channel driving highest retention — promote heavily in onboarding 5. Ambassador Priya (IG 12K) generated 28 referrals — consider micro-influencer collaboration ━━━━━━━━━━━━━━━━━━━━━━━━━━━━━━━━━━━━━━━━━━━
Key Features Delivered
Feature
Description
Unified Social Inbox
All comments, DMs, mentions, and reviews across 6 platforms consolidated in Agorapulse with auto-tagging and priority routing
AI-Assisted Response System
ChatGPT draft responses for high-volume interactions — community manager reviews in 5-10 seconds, maintaining consistent brand voice at 3× speed
Response Priority Framework
4-tier priority system ensuring critical interactions (complaints, purchase intent, support) get sub-1-hour responses
Facebook Group Revival
Spam-free, actively moderated group with daily themed content, weekly expert Q&A, and member recognition — active membership grew from 10% to 52%
Discord Community Build
10-channel structured server with gamification (XP/roles), weekly events, accountability partners, and exclusive content — DAU grew from 22 to 180
Challenge: FitVerse had 62K Instagram followers and 8,400 Facebook Group members but zero community management — 38-hour average response times, 61% of DMs unanswered, Facebook Group overrun with 35% spam, Discord dead at 22 daily users, 120+ monthly UGC posts going unacknowledged, no brand advocate program, no sentiment monitoring, and no crisis protocol.
Solution: We built a complete community management system — unified social inbox with AI-assisted responses, 4-tier priority framework, Facebook Group revival with themed daily content and active moderation, Discord community build with gamification and weekly events, automated UGC collection pipeline, 50-person Brand Ambassador program, real-time sentiment monitoring, 4-level crisis protocol, and a community health dashboard with AI intelligence reports.
Result: Response time dropped from 38 hours to 42 minutes. Sentiment improved from 74% to 94% positive. Facebook Group active membership grew 662%. Discord DAU grew from 22 to 180. UGC collection quadrupled. Ambassador program generates 142 content pieces and $6,400 monthly revenue. Community-attributed app downloads: 340+/month. App store rating climbed from 3.8 to 4.6 stars. Community members retain 34% better than non-members.
You Have an Audience. Do You Have a Community?
We build community management systems that turn passive followers into active participants, unanswered comments into brand loyalty, and your most passionate customers into a powerful ambassador army — all while protecting your reputation with real-time monitoring and crisis-ready protocols.
We built a comprehensive social media analytics and growth tracking system for PureGlow Skincare — replacing vanity metrics with revenue-connected intelligence that identified their highest-ROI content types, optimized posting strategy, and grew social-attributed revenue by 182%
Social Media Audit, KPI Framework Development, Cross-Platform Analytics Setup, Growth Tracking Dashboard, Competitor Benchmarking System, Content Performance Intelligence, ROI Attribution Model, Automated Reporting
Tools & Platforms Used
Sprout Social, Google Analytics 4, Google Looker Studio, Meta Business Suite, Instagram Insights, TikTok Analytics, YouTube Studio, Pinterest Analytics, Iconosquare, Brandwatch, Rival IQ, Google Sheets, Airtable, Zapier, Make (Integromat), ChatGPT API (OpenAI), Slack, Notion, Shopify (data source), WordPress
Project Year
2025
The Overview
PureGlow Skincare is a D2C beauty brand selling clean, cruelty-free skincare products through their Shopify store and marketplace presence. With active accounts on Instagram (48K followers), TikTok (22K), Facebook (18K), YouTube (8K), and Pinterest (12K), they were posting consistently — 4-5 times daily across platforms — but had zero visibility into what was actually working.
The social media manager tracked “likes and followers” in a basic spreadsheet updated monthly. That was the extent of their analytics. Nobody could answer fundamental questions: “Which platform actually drives sales?” “What content type generates the most revenue?” “Is our Instagram growing or stagnating?” “Should we invest more in TikTok or YouTube?” “What’s our actual ROI from social media?”
They were creating content in the dark — no data-driven decisions, no performance benchmarks, no competitor comparison, and no connection between social media activity and business revenue. High-effort content pieces that took hours to produce might generate zero sales, while a quick behind-the-scenes Story might drive thousands in revenue — but nobody could see the difference.
We built a complete social media analytics and growth tracking ecosystem that connects every platform’s data into unified dashboards, tracks content performance at the individual post level, attributes revenue to specific social activities, benchmarks against competitors, and delivers actionable intelligence that transforms social media from a “hope it works” activity into a measurable, optimizable revenue channel.
The Challenge
Vanity Metrics Obsession: The team celebrated follower count and likes while ignoring metrics that actually matter — engagement rate, reach rate, save rate, share rate, click-through rate, and most importantly, revenue attribution. A post with 2,000 likes and zero website clicks was celebrated equally to one with 200 likes and 40 purchases.
5 Platforms, Zero Unified View: Each platform had its own native analytics — Instagram Insights, TikTok Analytics, YouTube Studio, Facebook Insights, Pinterest Analytics — but data lived in 5 separate dashboards that couldn’t be compared, correlated, or aggregated. Getting a “total social media performance” view required manually checking each platform individually.
No Content Performance Intelligence: PureGlow published 140+ pieces of content monthly across platforms but had no system to identify:
Which content types perform best (carousel vs. Reel vs. static vs. Story)
Which topics resonate (ingredient education vs. routine tutorials vs. product launches vs. UGC)
Which posting times drive highest engagement
Which content drives website traffic vs. saves vs. shares
Which content actually generates purchases
No Revenue Attribution: Social media was treated as a “brand awareness” cost center because nobody could connect social activity to sales. The CEO questioned the ROI of a 3-person social team regularly. In reality, social was likely driving significant revenue — but without attribution, it was invisible and indefensible.
Competitor Blindness: PureGlow had no systematic process for tracking competitor social performance. They had no idea if their engagement rates were industry-leading or lagging, if competitors were growing faster, or what content strategies were working for similar brands.
No Growth Trajectory Tracking: Follower count was checked casually once a month. There was no tracking of growth rate, growth velocity, follower quality, audience demographics shifts, unfollower patterns, or growth by source (organic vs. paid vs. viral).
Manual, Incomplete Reporting: The monthly social media “report” was a Google Doc with screenshots of follower counts and top-liked posts. It took 4 hours to compile, contained no actionable insights, and was delivered 2 weeks after month-end.
Our Approach & Strategy
Phase 1: Social Media Audit & KPI Framework (Week 1)
Content Type Performance Analysis (Instagram Deep-Dive):
Content Type
Volume (12 months)
Avg Engagement Rate
Avg Saves
Avg Shares
Avg Website Clicks
Revenue Attributed
Static Product Photos
380 posts
1.2%
18
4
8
Unknown
Carousel (Educational)
82 posts
3.8%
86
32
28
Unknown
Reels (Tutorial)
64 videos
4.6%
124
68
42
Unknown
Reels (Trending Audio)
48 videos
5.2%
42
94
12
Unknown
Stories
420+
2.1% (reply rate)
N/A
N/A
34 avg/day
Unknown
UGC Reposts
34 posts
3.2%
44
28
22
Unknown
Product Launch Posts
28 posts
2.4%
36
18
64
Unknown
Key Finding: Educational carousels and tutorial Reels dramatically outperformed static product photos (3-4× engagement) — yet 49% of content was static product shots. The team was overproducing their worst-performing format.
KPI Framework (Metrics That Actually Matter):
KPI Category
Metrics
Why It Matters
Growth
Follower growth rate (%), net new followers/week, growth velocity trend, follower quality score
Are we growing, and is growth accelerating or decelerating?
Videos — views, engagement, FYP reach, profile visits, link clicks
API → Looker Studio
Facebook
Sprout Social + Meta Business Suite
Posts — reach, engagement, clicks, video views
API → Looker Studio
YouTube
YouTube Studio API + Sprout Social
Videos — views, watch time, CTR, subscribers gained, traffic sources
API → Looker Studio
Pinterest
Pinterest Analytics API + Sprout Social
Pins — impressions, saves, clicks, closeups
API → Looker Studio
All Platforms → Website
GA4 + UTM tracking
Social referral traffic, behavior flow, conversions
GA4 → Looker Studio
Website → Revenue
Shopify + GA4
Purchase attribution from social referral
Shopify → GA4 → Looker Studio
UTM Tracking System (Every Link Tagged):
textUTM STRUCTURE FOR SOCIAL MEDIA
━━━━━━━━━━━━━━━━━━━━━━━━━━━━━━

LINK IN BIO:
?utm_source=instagram&utm_medium=social&utm_campaign=link-in-bio&utm_content=main-bio-link

STORY LINK:
?utm_source=instagram&utm_medium=social&utm_campaign=story-swipeup&utm_content=[post-topic]-2026

REEL CTA:
?utm_source=instagram&utm_medium=social&utm_campaign=reel-cta&utm_content=[reel-topic]-2026

TIKTOK BIO:
?utm_source=tiktok&utm_medium=social&utm_campaign=link-in-bio&utm_content=main-bio-link

PINTEREST PIN:
?utm_source=pinterest&utm_medium=social&utm_campaign=pin&utm_content=[pin-title]-[board]

FACEBOOK POST:
?utm_source=facebook&utm_medium=social&utm_campaign=organic-post&utm_content=[topic]-2026
━━━━━━━━━━━━━━━━━━━━━━━━━━━━━━━━━━━━━━━━━━━━━
[/protected]
Built a UTM generator tool in Google Sheets — social team selects platform, campaign type, and content topic from dropdowns → auto-generates tagged URL. No more guessing or inconsistent tracking.
Social-to-Revenue Attribution Model:
textREVENUE ATTRIBUTION FLOW
━━━━━━━━━━━━━━━━━━━━━━━━

LEVEL 1: DIRECT ATTRIBUTION (Last-Click)
  → User clicks UTM-tagged link in social → lands on Shopify
  → Purchases within session → Revenue credited to that social post
  → Tracked in: GA4 + Shopify attribution

LEVEL 2: ASSISTED ATTRIBUTION (Multi-Touch)
  → User sees Instagram Reel (Day 1) → Visits website from
     bio link (Day 3) → Returns via Google search (Day 6)
     → Purchases
  → Social credited as "assisted conversion" with weighted attribution
  → Tracked in: GA4 multi-channel funnel report

LEVEL 3: INFLUENCED ATTRIBUTION (View-Through)
  → Correlate social posting activity with overall revenue trends
  → Did revenue spike when certain content went live?
  → Weekly correlation analysis: social engagement ↔ revenue
  → Tracked in: Custom Looker Studio correlation widget

RESULT: Three levels of attribution showing social's FULL
revenue impact — not just last-click (which undervalues social)
━━━━━━━━━━━━━━━━━━━━━━━━━━━━━━━━━━━━━━━━━━━━━━
Competitor Tracking System (Rival IQ + Brandwatch):
Identified 6 direct competitors to track continuously:
Competitor
Instagram
TikTok
Why Track
Competitor A (Market Leader)
186K
94K
Content strategy benchmark, aspiration target
Competitor B (Direct Rival)
52K
28K
Closest competitor, market share battle
Competitor C (Fast Grower)
34K
68K
TikTok-first strategy worth studying
Competitor D (Premium Brand)
42K
12K
Brand positioning reference
Competitor E (Indie Darling)
28K
44K
Community-building approach to learn from
Competitor F (International)
120K
56K
Global best practices to adapt locally
Competitive Benchmarking Dashboard:
Metric
PureGlow
Industry Avg
Top Competitor
Gap
IG Engagement Rate
1.8%
3.5%
5.2%
-3.4% (major gap)
IG Growth Rate/Month
+1.2%
+2.8%
+4.6%
-3.4% (falling behind)
TikTok Avg Views
4,200
12,000
48,000
Need viral content strategy
Content Mix (Video %)
28%
55%
72%
Underweight on video
Posting Frequency (IG)
2.1/day
1.5/day
1.8/day
Posting MORE but performing LESS
Saves per Post (IG)
18 avg
45 avg
124 avg
Save-worthy content deficit
UGC as % of Content
4%
18%
32%
Massive UGC opportunity
Key Insight: PureGlow was posting MORE frequently than competitors but getting LESS engagement — indicating a quality problem, not a quantity problem. The data showed they should post 30% less but make each piece significantly more valuable.
Content Intelligence Framework:
Built an Airtable Content Performance Database tracking every post across all platforms:
Challenge: PureGlow Skincare was active on 5 social platforms, publishing 140+ posts monthly, but tracking only vanity metrics (likes and followers) in a manual spreadsheet. No revenue attribution, no content performance scoring, no competitor benchmarking, no unified dashboard, and no way to answer “is social media actually making us money?” The team overproduced low-performing static product photos while underinvesting in high-engagement formats.
Solution: We built a complete social media analytics ecosystem — unified 5-platform tracking via Sprout Social, a value-based KPI framework replacing vanity metrics, a 100-point content performance scoring system, 3-level revenue attribution connecting social to Shopify sales, continuous competitor benchmarking against 6 brands, 4 real-time Looker Studio dashboards, automated reporting, intelligent alerts, and monthly AI strategy briefings.
Result: Social-attributed revenue grew 182% ($8,200 to $23,100/month) while actually publishing 32% fewer posts (quality over quantity). Instagram engagement rate jumped from 1.8% to 4.1%. Content production shifted to data-proven formats. Pinterest revealed as highest revenue-per-follower platform ($0.34). Social ROI proven at 4.2× return. Every strategic decision now backed by data, not gut feeling.
Are You Measuring Social Media Success by Likes — or by Revenue?
We build social media analytics systems that go beyond vanity metrics — tracking what actually matters, connecting social activity to real revenue, benchmarking against competitors, and delivering actionable intelligence that transforms your social media from guesswork into a measurable growth engine.
We built and managed a multi-platform paid advertising system for UrbanStay Serviced Apartments — reducing cost per booking by 62%, increasing ROAS from 2.4× to 9.1×, and scaling monthly ad-driven revenue from $38,000 to $142,000 across Google, Meta, and YouTube.
Google Ads, Meta Ads Manager (Facebook + Instagram), YouTube Ads, Google Analytics 4, Google Tag Manager, Google Looker Studio, SEMrush, SpyFu, Unbounce, Hotjar, ChatGPT API (OpenAI), Canva, CapCut Pro, Zapier, HubSpot CRM, Google Sheets, Airtable, Slack, WordPress
Project Year
2025
The Overview
UrbanStay operates 120 premium serviced apartments across Bangalore, Hyderabad, and Pune — targeting business travelers, relocating professionals, and medical tourists seeking furnished, hotel-alternative stays of 3-30+ nights. Average booking value: $680. Monthly marketing budget: $18,000 across Google Ads and Facebook Ads.
Despite spending $18,000/month, UrbanStay was barely breaking even on paid advertising. Their Google Ads account was a graveyard of bloated campaigns with 2,400+ keywords (most irrelevant), broad match types bleeding budget on unqualified searches, and zero negative keyword management. Their Facebook Ads consisted of boosted posts with no audience strategy, no funnel alignment, and no conversion tracking. YouTube — their highest-potential platform for showcasing beautiful apartments — was completely untouched.
The result: Cost per booking of $186 on a $680 average booking value. After operational costs and commissions, each ad-acquired booking generated almost zero profit. The marketing team was spending $18,000/month to essentially run in place.
We rebuilt the entire paid advertising operation from the ground up — auditing and restructuring every campaign, fixing conversion tracking, building proper audience targeting, creating platform-specific creative strategies, launching YouTube ads, implementing a retargeting funnel, and establishing data-driven optimization processes that turned paid ads from a cost center into UrbanStay’s most profitable growth engine.
The Challenge
Google Ads Chaos:
2,400+ keywords across 14 campaigns with no logical structure
68% of keywords on broad match — triggering for irrelevant searches like “cheap hotel rooms,” “free stay,” “apartment for sale”
Zero negative keywords in 18 months of running
Search term report revealed 42% of clicks came from completely irrelevant queries
No ad extensions configured (sitelinks, callouts, structured snippets, location, call)
Single landing page (homepage) for all ads regardless of keyword intent
No conversion tracking — optimizing for clicks, not bookings
Monthly Google Ads spend: $12,000 | Trackable bookings: ~38 | Cost per booking: $316
Meta Ads Negligence:
All “campaigns” were boosted posts — no Ads Manager campaigns with proper objectives
No Meta Pixel installed — zero conversion tracking
Audience targeting: “All India, Age 18-65” (essentially no targeting)
No retargeting audiences built
Creative: static property photos with no compelling copy or CTA
Monthly Meta spend: $6,000 | Trackable bookings: ~26 | Cost per booking: $231
Zero Retargeting: 94% of website visitors left without booking. With 8,400 monthly visitors, that’s ~7,900 interested prospects vanishing with zero follow-up. No retargeting pixels installed on any platform.
No YouTube Presence: Serviced apartments are highly visual products — YouTube is the ideal platform for virtual tours, testimonials, and lifestyle content. Yet UrbanStay had zero YouTube ad presence despite competitors running successful video campaigns.
Landing Page Disaster: Every ad — regardless of whether someone searched “serviced apartment Bangalore,” “corporate housing Hyderabad,” or “monthly stay Pune” — landed on the generic homepage. No city-specific landing pages, no intent-matched messaging, no booking-focused design.
Attribution Black Hole: No proper conversion tracking meant the team couldn’t distinguish between campaigns generating bookings and campaigns burning cash. Budget allocation was based on gut feeling, not data.
Competitive Disadvantage: Top 3 competitors had:
Structured Google Ads with dedicated landing pages per city
Professional Meta Ads with video creatives and lookalike audiences
YouTube pre-roll ads with virtual apartment tours
Retargeting across all platforms
Average CPA 40-60% lower than UrbanStay
Our Approach & Strategy
Phase 1: Tracking Foundation & Competitive Intelligence (Week 1)
Conversion Tracking Infrastructure:
Platform
Tracking Implemented
Conversion Events
Google Ads
Enhanced conversions via GTM
Booking completed (primary), booking form started, phone call click, WhatsApp click, date search initiated
Video views (25/50/75/100%), website visit from video, booking from video viewer
Google Analytics 4
Enhanced e-commerce configured
Full booking funnel: property view → date selection → form start → form complete → booking confirmed
HubSpot CRM
Zapier integration
Every booking lead auto-created with source attribution — connecting ad click to closed booking
Competitive Intelligence Audit (SEMrush + SpyFu):
Competitor
Monthly Ad Spend (Est.)
Top Keywords
Creative Strategy
Gap/Opportunity
Competitor A
$22,000
“serviced apartments bangalore,” “corporate stay”
Video tours + testimonial ads
Strong on search, weak on retargeting
Competitor B
$15,000
“furnished apartments,” “monthly rentals”
Professional photography + carousel
No YouTube presence
Competitor C
$18,000
“business traveler accommodation”
Lifestyle video ads + UGC
Weak landing pages (homepage only)
Key Insight: No competitor had a fully integrated multi-platform strategy with dedicated landing pages + retargeting + YouTube. This was UrbanStay’s opportunity to leapfrog all three.
Campaign 7: [Retargeting] Website Visitors → Audience: Visited site, didn't book (7-30 day window) → Creative: Dynamic property ads based on pages viewed → Budget: $1,200/month
Campaign 8: [Retargeting] Booking Abandoners → Audience: Started booking form but didn't complete → Creative: "Still interested? Your apartment is waiting" → Budget: $800/month
PERFORMANCE MAX:
Campaign 9: [PMax] All Properties → Asset groups by city with images, videos, headlines → Audience signals: business travelers, relocation, medical travel → Budget: $2,000/month
TOTAL GOOGLE ADS BUDGET: $15,300/month (Reallocated from original $12,000 + $3,300 from Meta optimization savings) ━━━━━━━━━━━━━━━━━━━━━━━━━━━━━━━━━━━━━━━━━━
Ad Copy Strategy (Per Campaign):
Ad Element
Before
After
Headlines
“UrbanStay Apartments” (generic)
“Serviced Apartments in Bangalore — Book Direct & Save 15%” / “Fully Furnished, Wi-Fi, Housekeeping — From ₹3,500/Night”
Descriptions
“We offer apartments. Contact us.”
“120+ Premium Serviced Apartments Across 3 Cities. Ideal for Business Travelers & Relocations. Flexible 3-30+ Night Stays. Book Direct for Best Rates. Free Airport Pickup on Stays 7+ Nights.”
15 headlines + 4 descriptions per RSA — Google auto-optimizes combinations
Bid Strategy Shift:
Before
After
Why
Manual CPC (set and forget)
Target CPA (automated)
Let Google’s AI optimize for actual bookings, not clicks
Optimizing for clicks
Optimizing for conversions (bookings)
Only pay effectively for what matters
Same bid every keyword
Bid adjustments by device (+20% mobile), location, time of day, audience
Higher bids when conversion probability is highest
Quality Score Improvement Plan:
Factor
Before (Avg 3.8)
After (Avg 7.4)
How
Ad Relevance
Below average
Above average
Tight keyword-to-ad matching, specific ad copy per ad group
Landing Page Experience
Below average
Above average
City-specific landing pages matching ad intent
Expected CTR
Below average
Above average
Compelling ad copy, extensions, RSA optimization
Phase 3: Meta Ads Strategy & Build (Week 3)
Campaign Architecture (Full-Funnel):
META ADS FUNNEL ARCHITECTURE ━━━━━━━━━━━━━━━━━━━━━━━━━━━━
TOFU — AWARENESS (30% of budget — $1,800/month) ━━━━━━━━━━━━━━━━━━━━━━━━━━━━━━━━━━━━━━━━━━━━━ Campaign: Brand Awareness — Video Views → Objective: Video Views (ThruPlay) → Creative: 30-60 sec apartment tour videos (3 per city) → Audience: • Interest: Business travel, corporate housing, relocation • Lookalike: 1% of past bookers • Demographics: Age 25-55, income targeting → Goal: Build awareness pool for retargeting
Homepage visitors → Google Display: Brand awareness banner (didn't go deeper) Meta: Video tour of featured apartments YouTube: "Discover UrbanStay" pre-roll
Property page viewers → Google Display: Dynamic ad showing viewed property (browsed specific city) Meta: Carousel of apartments in that city YouTube: City-specific tour video
Date search initiated → Google Display: "Apartments available for your dates!" (checked availability) Meta: Urgency ad — "Limited availability for [dates]" Email: If captured — availability confirmation
Booking form started → Google Display: "Complete your booking — special offer inside" (abandoned form) Meta: "Your apartment is still available" with discount Email: If captured — abandoned booking recovery (3-email sequence) SMS: If captured — 24-hour booking reminder
Past guest → Google Display: "Welcome back" loyalty offer (stayed previously) Meta: "Book your next stay — loyal guest discount" Email: Replenishment email based on past stay patterns YouTube: "What's new at UrbanStay" update video
CROSS-PLATFORM FREQUENCY CAP: Max 4 retargeting impressions/day/person (prevents ad fatigue and annoyance) ━━━━━━━━━━━━━━━━━━━━━━━━━━━━━━━━━━━━━━━━━━━━━
Cross-Platform Budget Orchestration:
Platform
Monthly Budget
% of Total
Primary Role
Google Search
$11,300
44%
Capture high-intent searches (bottom funnel)
Google Display/Remarketing
$2,000
8%
Retarget website visitors
Google PMax
$2,000
8%
AI-optimized cross-network reach
Meta Ads (TOFU)
$1,800
7%
Awareness — video tours, lookalike audiences
Meta Ads (MOFU)
$1,800
7%
Consideration — testimonials, carousels
Meta Ads (BOFU)
$2,400
9%
Conversion — retargeting, offers
YouTube Ads
$4,000
15%
Brand building + retargeting (high-impact visual)
Testing Budget
$700
2%
Reserved for new creative/audience tests
Total
$26,000/month
100%
Budget increased from $18,000 to $26,000 — justified by improved efficiency making each dollar work 3-4× harder. At the new ROAS of 9.1×, the additional $8,000 generates approximately $72,800 in additional revenue.
Views, VTR (view-through rate), cost per view, website visits from video, bookings attributed
Landing Pages
Conversion rate per landing page, bounce rate, form completion rate, time on page
Retargeting
Audience size, frequency, conversion rate, ROAS — by segment (viewers vs. abandoners vs. past guests)
Testing
Active tests, completed tests, winning variants, cumulative performance lift
Competitor Monitor
Competitor ad visibility, estimated spend, new creative detected
Budget Pacing
Daily/weekly spend vs. budget, projected month-end spend, over/under alerts
Automated Alerts:
Alert
Trigger
Action
CPA spike
Any campaign CPA exceeds target by 30%+ for 2 days
Slack alert → investigate + pause if needed
Budget pacing
Campaign on track to overspend by 15%+
Slack alert → adjust daily budget
Quality Score drop
Any keyword QS drops below 5
Slack alert → audit ad relevance + landing page
Creative fatigue
Any ad CTR drops 25%+ from peak
Slack alert → refresh creative
Conversion tracking error
Zero conversions recorded for 24 hours (unusual)
Slack urgent alert → check GTM/pixel
Competitor new campaign
SpyFu detects competitor launching new keyword set
Slack weekly digest → evaluate response
High performer detected
Any campaign exceeds ROAS 12×+ for 3 days
Slack celebration 🎉 → increase budget 20%
Monthly AI Strategy Report:
URBANSTAY PPC INTELLIGENCE — MARCH 2025
━━━━━━━━━━━━━━━━━━━━━━━━━━━━━━━━━━━━━━━

📊 OVERALL: Excellent (ROAS: 9.1× | Target: 7×)

💰 REVENUE & SPEND:
  Total ad spend: $26,000
  Total ad-attributed revenue: $142,480
  Blended ROAS: 9.1× (↑ from 8.4× Feb)
  Total bookings from ads: 204 (↑ from 186 Feb)
  Cost per booking: $127 (↓ from $142 Feb)

🏆 TOP PERFORMERS:
  1. Google Search [Bangalore]: ROAS 12.4× — 68 bookings
  2. Meta Retargeting [Booking Abandoners]: ROAS 18.6× — 24 bookings
  3. YouTube In-Stream [Apartment Tours]: ROAS 6.8× — building pipeline

📉 UNDERPERFORMERS:
  • Google Search [Generic/Non-Branded]: ROAS 3.2× — refine keywords
  • Meta TOFU [Interest Targeting]: High reach, low conversion —
    test new interest combinations

🧪 TEST RESULTS:
  • "Free Airport Pickup" offer beat "15% discount" by 34% conversion rate
  • Testimonial video ads outperformed tour videos by 28% CTR on Meta
  • Bangalore landing page with pricing visible: +22% conversion vs. hidden

🎯 NEXT MONTH ACTIONS:
  1. Increase Bangalore search budget 20% (highest ROAS city)
  2. Roll out "Free Airport Pickup" offer across all campaigns
  3. Shift Meta TOFU budget toward testimonial-style creatives
  4. Launch dedicated "Medical Stay" campaign for Bangalore hospitals
  5. Test YouTube Discovery ads targeting relocation-related searches
  6. Create dynamic remarketing for Pune (currently only static ads)

💡 BUDGET RECOMMENDATION:
  Increase total budget to $30,000 (+$4,000)
  Additional $4K allocated to Bangalore Search (+$2K) and
  YouTube retargeting (+$2K) — projected incremental
  revenue: $36,000+ at current ROAS levels
━━━━━━━━━━━━━━━━━━━━━━━━━━━━━━━━━━━━━━━━━━
Key Features Delivered
Feature
Description
Full Google Ads Rebuild
2,400 chaotic keywords restructured into 9 strategic campaigns with city-specific targeting, competitor campaigns, and Performance Max — Quality Score improved from 3.8 to 7.4
Segmented retargeting across Google, Meta, and YouTube — different messaging for homepage visitors, property viewers, date searchers, booking abandoners, and past guests
840+ Negative Keywords
Comprehensive negative keyword list eliminating $2,800/month in previously wasted spend on irrelevant searches
Conversion Tracking Infrastructure
End-to-end tracking from ad click to confirmed booking with revenue attribution across all platforms via GTM, Pixel, CAPI, and CRM integration
Structured Testing Program
Systematic A/B testing across ad copy, landing pages, audiences, creatives, bid strategies, and offers with weekly optimization rhythm
Cross-Platform Budget Orchestration
Data-driven budget allocation across Google, Meta, and YouTube with weekly rebalancing toward highest-performing channels
PPC Performance Dashboard
Real-time Looker Studio dashboard tracking revenue, cost efficiency, platform performance, landing pages, retargeting, and competitor monitoring
Automated Alert System
Instant notifications for CPA spikes, budget pacing, QS drops, creative fatigue, tracking errors, and high-performance detection
Monthly AI Strategy Report
ChatGPT-generated analysis with performance summary, winners, underperformers, test results, and budget recommendations
Challenge: UrbanStay spent $18,000/month on paid ads with a dismal 2.4× ROAS — 2,400 chaotic Google Ads keywords with 42% irrelevant clicks, boosted Facebook posts with zero conversion tracking, no YouTube presence, no retargeting, all ads landing on the generic homepage, and a $186 cost per booking on $680 average booking value.
Solution: We rebuilt the entire paid advertising operation — restructured Google Ads into 9 precision campaigns, built a full-funnel Meta Ads strategy with proper Pixel/CAPI tracking, launched YouTube ads with 12 video creatives, created 8 intent-matched landing pages, deployed multi-platform retargeting across 5 visitor segments, implemented 840+ negative keywords, and established a data-driven weekly optimization rhythm with AI-powered monthly strategy reports.
Result: ROAS improved from 2.4× to 9.1×. Cost per booking dropped 62% ($186 to $71). Monthly ad-attributed revenue grew from $38,000 to $142,000. Bookings from ads tripled. Landing page conversion increased 367%. $2,800/month in wasted spend eliminated. YouTube ads generate 28 bookings/month. Retargeting converts at 4.8%. Annual ad-attributed revenue trajectory: $1.7M.
Burning Money on Ads That Don’t Convert? Let’s Fix That.
We audit, rebuild, and manage paid advertising campaigns across Google, Meta, and YouTube — eliminating wasted spend, fixing conversion tracking, building retargeting funnels, and optimizing relentlessly until every ad dollar works harder than the last.
We executed a full-scale SEO transformation for LegalShield India — fixing 142 technical errors, optimizing 85 pages, building 120+ authoritative backlinks, and growing organic traffic from 3,200 to 28,400 monthly sessions with a 640% increase in qualified lead generation from search.
Technical SEO Audit & Fix, On-Page SEO Optimization, Keyword Strategy & Content Mapping, Link Building Campaign, Site Architecture Restructuring, Schema Markup Implementation, Core Web Vitals Optimization, SEO Reporting & Monitoring
Tools & Platforms Used
Ahrefs, SEMrush, Screaming Frog, Google Search Console, Google Analytics 4, Google PageSpeed Insights, GTmetrix, SurferSEO, Yoast SEO, WordPress, Google Tag Manager, Google Looker Studio, ChatGPT API (OpenAI), Canva, HARO, Zapier, Slack, Airtable, Notion
Project Year
2025
The Overview
eLegalShield is a full-service law firm with practices in corporate law, intellectual property, real estate, family law, immigration, and dispute resolution. With 18 attorneys and a strong offline reputation built over 12 years, they were the firm people recommended in person — but online, they were practically invisible.
Their website had been built 4 years ago and never touched since. It had 62 pages of thin, unoptimized content, a crawl error rate of 23%, page load times exceeding 8 seconds, zero backlinks from authoritative sources, and no discernible keyword strategy. When potential clients searched “corporate lawyer Mumbai,” “IP attorney India,” or “divorce lawyer near me” — eLegalShield didn’t appear anywhere in the first 5 pages of results.
Meanwhile, competitors with weaker legal expertise but stronger digital presence were capturing thousands of high-intent searches every month. In legal services, where a single client can be worth $5,000-$50,000+, every first-page ranking represents significant revenue potential.
We executed a comprehensive SEO transformation — fixing every technical issue, restructuring the site architecture, optimizing every page for target keywords, building a strategic backlink profile, and implementing ongoing content and monitoring systems that turned eLegalShield from invisible to dominant in their key practice areas.
Google Core Web Vitals failing on all metrics — direct ranking penalty
Mobile Usability
34 mobile usability errors — text too small, clickable elements too close, content wider than screen
68% of legal searches happen on mobile — terrible experience
Security
Mixed content warnings (HTTP images on HTTPS pages)
Browser security warnings reducing trust
Structured Data
Zero schema markup on any page
No rich snippets, no enhanced search appearance
XML Sitemap
Outdated, including deleted pages, missing new pages
Google crawling phantom pages, missing real ones
On-Page SEO Disaster: Of 62 existing pages:
41 had no meta descriptions
38 had duplicate or missing title tags
52 had no target keyword strategy
47 had zero internal links to/from other pages
28 had thin content (under 300 words) on practice area pages
0 had optimized heading structures (H1/H2/H3)
0 had image alt text
Zero Keyword Strategy: No keyword research had ever been conducted. Page titles were generic — “Corporate Law” instead of “Corporate Lawyer in Mumbai — Business Legal Services.” Content was written for the firm, not for searchers.
Non-Existent Backlink Profile:
Total referring domains: 14 (mostly spam directories)
Domain Authority (Ahrefs DR): 8/100
Zero backlinks from legal publications, news sites, or authoritative directories
Competitors averaged 120-400 referring domains with DR 35-55
Poor Site Architecture: No logical hierarchy. Practice areas, attorney profiles, blog posts, and contact pages all sat at the same URL level with no internal linking strategy. Users and Google bots alike got lost navigating the site.
Content Gaps: Competitors ranked for hundreds of high-intent keywords that eLegalShield had zero content for:
“How to register a trademark in India” — competitor gets 4,200 searches/month
“Divorce process in Mumbai” — competitor gets 2,800 searches/month
“Corporate lawyer fees in India” — competitor gets 1,400 searches/month
eLegalShield had no content addressing any of these topics
Unmeasured Performance: No Google Search Console connected. GA4 installed but misconfigured. No rank tracking. No organic performance baseline. The firm had no idea how they performed in search or what they were missing.
Our Approach & Strategy
Phase 1: Technical SEO Audit & Foundation Repair (Week 1-2)
Visibility comparison vs. 5 competitors, keyword overlap, gap opportunities
ROI Calculation
Organic leads × average client value = estimated revenue from SEO
Automated Monitoring Alerts:
Alert
Trigger
Notification
Ranking Drop
Any top-20 keyword drops 5+ positions
Slack: SEO team
Traffic Anomaly
Organic traffic drops 20%+ vs. 7-day average
Slack + Email: Marketing director
Technical Error
New crawl error, indexation issue, or CWV failure detected
Slack: Dev team + SEO team
New Backlink
High-authority link (DR 40+) acquired
Slack celebration 🎉
Lost Backlink
Any DR 30+ backlink lost
Slack alert: investigate and recover
Competitor Movement
Competitor enters top 3 for priority keyword
Slack: SEO team
Featured Snippet Won
eLegalShield captures new featured snippet
Slack celebration 🏆
Monthly SEO Intelligence Report (AI-Generated):
eLEGALSHIELD SEO INTELLIGENCE — MARCH 2025
━━━━━━━━━━━━━━━━━━━━━━━━━━━━━━━━━━━━━━━━

📊 PERFORMANCE: Excellent (Score: 86/100, ↑9 vs Feb)

🔍 ORGANIC TRAFFIC: 28,400 sessions (↑22% vs Feb)
  Top landing page: "Trademark Registration India" (4,200 sessions)
  Fastest growing: "Divorce Process Mumbai" (↑84% MoM)

📈 RANKINGS:
  Keywords in top 3: 34 (↑8 vs Feb)
  Keywords in top 10: 82 (↑14 vs Feb)
  Keywords in top 20: 128 (↑18 vs Feb)
  Featured snippets: 12 (↑3 vs Feb)
  New #1 positions: "trademark registration India,"
    "corporate lawyer Mumbai," "RERA complaint process"

🔗 BACKLINKS:
  New referring domains: 22 (monthly)
  Domain Rating: 41 (↑4 vs Feb)
  Notable new links: Bar & Bench feature, LiveLaw guest article,
    Mumbai Mirror quote

📞 CONVERSIONS (from organic):
  Form submissions: 186 (↑38% vs Feb)
  Phone calls (tracked): 94 (↑42% vs Feb)
  WhatsApp inquiries: 62 (↑28% vs Feb)
  Total organic leads: 342 (↑36% vs Feb)
  Estimated lead value: 342 × $850 avg = $290,700 potential

💰 SEO ROI:
  Monthly SEO investment: $4,500
  Leads generated: 342
  Cost per organic lead: $13.16
  (vs. Google Ads legal CPC: $8-25 per CLICK, not per lead)
  Estimated revenue from SEO leads (assuming 15% close): $43,605

🎯 NEXT MONTH PRIORITIES:
  1. Target "business lawyer Mumbai" — currently #6, push to top 3
  2. Create immigration law cluster (14 keywords, 8,400 monthly volume)
  3. Build 5 university backlinks via guest lecture program
  4. Refresh "company registration" guide — competitor published newer version
  5. Expand FAQ schema to 10 additional pages
━━━━━━━━━━━━━━━━━━━━━━━━━━━━━━━━━━━━━━━━━━━━━━
Ongoing Optimization Protocol:
Frequency
Activity
Weekly
Rank tracking review, technical error monitoring, competitor movement check
Bi-weekly
2 new blog posts published (ongoing content production)
Monthly
Backlink outreach batch, content refresh on declining pages, performance report
Quarterly
Full technical re-audit, keyword strategy refresh, site architecture review, Core Web Vitals check
Bi-annually
Comprehensive competitor re-analysis, content audit, link profile audit
Key Features Delivered
Feature
Description
142-Issue Technical SEO Fix
Complete resolution of crawl errors, broken links, redirect chains, indexation blocks, mixed content, and mobile usability issues
Core Web Vitals Optimization
LCP from 6.8s to 1.8s, FID from 420ms to 45ms, CLS from 0.34 to 0.04 — all metrics passing Google’s thresholds
Site Architecture Restructuring
Flat 62-page site reorganized into logical hierarchy with 85 optimized pages, 3-click max depth, and strategic internal linking
180-Keyword Strategy
Research-backed keyword map covering informational, commercial, transactional, and local intent across all practice areas
85 Pages Fully Optimized
Every page with keyword-targeted title, meta description, heading structure, content depth, internal links, schema, and image optimization
Challenge: eLegalShield’s website had 142 technical SEO errors, 8-second load times, failing Core Web Vitals, zero keyword strategy, thin content averaging 280 words, only 14 referring domains (DR 8), and no schema markup. They ranked nowhere for any valuable legal keyword — generating just 46 organic leads monthly while competitors dominated search results.
Solution: We executed a comprehensive SEO transformation — fixing all 142 technical issues, optimizing Core Web Vitals (LCP from 6.8s to 1.8s), restructuring site architecture from 62 to 85 optimized pages, mapping 180 keywords across all practice areas, building 120+ quality backlinks from legal publications and media, implementing 9 types of schema markup, producing 38 new content assets, and establishing ongoing monitoring with AI-powered reporting.
Result: Organic traffic grew from 3,200 to 28,400 monthly sessions (788% increase). Keywords in top 3 jumped from 2 to 34. Domain Rating climbed from 8 to 41. Organic leads increased 643% to 342/month at $13.16/lead (vs. $8-25 per click on Google Ads). 12 featured snippets captured. Estimated monthly revenue from SEO: $43,600. All Core Web Vitals now passing. Zero technical errors maintained.
Invisible on Google? Every Day You Don’t Rank, Competitors Get Your Clients.
We execute comprehensive SEO transformations — fixing technical foundations, optimizing every page, building authoritative backlinks, and creating content that ranks — so your ideal clients find you first when they search for what you offer.
We executed a complete local SEO and Google Business Profile strategy for SparkSmile Dental Group’s 5 clinic locations — achieving top-3 Google Maps rankings for 87% of target keywords, increasing appointment bookings from Google by 214%, and generating 340+ new patient inquiries monthly from local search alone.
Local SEO Strategy, Google Business Profile Optimization, Multi-Location GBP Management, Local Citation Building & Cleanup, Review Generation & Reputation Management, Local Content Strategy, Local Link Building, Google Maps Ranking Optimization, Local Schema Markup, Competitor Analysis & Monitoring
Tools & Platforms Used
Google Business Profile, Google Search Console, Google Analytics 4, BrightLocal, Whitespark, Yext, Moz Local, SEMrush, Ahrefs, ChatGPT API (OpenAI), Zapier, Google Sheets, Airtable, Slack, Podium, WordPress, Yoast SEO, Google Looker Studio, Canva
Project Year
2025
The Overview
SparkSmile Dental Group operates 5 dental clinics across Chennai — in Anna Nagar, T. Nagar, Velachery, OMR (Sholinganallur), and Tambaram. Each clinic offers general dentistry, cosmetic dentistry, orthodontics, dental implants, and pediatric dentistry. With 12 dentists, a strong clinical reputation, and average patient value of $420/year, they had the quality — but patients couldn’t find them online.
When someone in Chennai searched “dentist near me,” “dental clinic Anna Nagar,” or “teeth whitening Chennai,” SparkSmile was invisible. Their Google Business Profiles were incomplete, inconsistent, and unoptimized. Their local SEO was nonexistent. Competitors with inferior clinical quality but superior local marketing were capturing 80%+ of the local search traffic — and converting those searchers into patients that should have been SparkSmile’s.
In local healthcare, visibility equals viability. 76% of people who search for a local business visit within 24 hours. 28% of those searches result in a purchase. SparkSmile was missing this massive stream of high-intent patients every single day.
We built a comprehensive local SEO and Google Business Profile domination strategy across all 5 locations — optimizing every profile, building local authority, generating reviews at scale, creating locally-targeted content, and establishing SparkSmile as the most visible and trusted dental brand in Chennai’s local search results.
The Challenge
Incomplete & Inconsistent Google Business Profiles: All 5 clinic GBPs had critical issues:
Issue
Locations Affected
Impact
Missing or wrong business hours
4 of 5
Patients showing up when clinic closed
Wrong phone numbers
2 of 5
Calls going to disconnected lines
No business description
5 of 5
Zero keyword signals for Google
Missing service categories
5 of 5
Not appearing for specialty searches
Zero Google Posts published
5 of 5
No freshness signals, no offers visible
Low-quality or missing photos
5 of 5
Unappealing profiles vs. competitors
No Q&A section answers
5 of 5
Unanswered questions creating doubt
Missing attributes
5 of 5
Safety protocols, accessibility, payment options not shown
Inconsistent NAP across web
5 of 5
Different name/address/phone across directories killing rankings
Google Maps Invisibility: Rankings across target keywords:
Keyword
Anna Nagar
T. Nagar
Velachery
OMR
Tambaram
“dentist near me”
#18
#22
Not ranked
#15
Not ranked
“dental clinic [area name]”
#12
#14
#20
#11
#19
“teeth whitening Chennai”
Not ranked
Not ranked
Not ranked
Not ranked
Not ranked
“dental implants Chennai”
Not ranked
Not ranked
Not ranked
Not ranked
Not ranked
“best dentist [area name]”
#16
#19
Not ranked
#14
Not ranked
Zero locations in Google’s Local 3-Pack (the top 3 Maps results that capture 44% of all local clicks).
Review Deficit: Average Google rating across locations: 3.8 stars with only 124 total reviews across all 5 clinics (avg 25 per location). Top competitor: 4.7 stars with 680+ reviews at a single location. Reviews are the #1 local ranking factor — SparkSmile was being crushed.
NAP Inconsistency Chaos: Business name, address, and phone (NAP) listed differently across 40+ online directories, maps, and healthcare portals. Google penalizes inconsistent NAP data by reducing local ranking confidence.
No Local Content: Website had zero location-specific pages. No “Dentist in Anna Nagar” page, no “Dental Implants in OMR” page. Without location-targeted content, Google had no reason to show SparkSmile for area-specific searches.
Competitor Domination: Top 3 competitors had invested heavily in local SEO:
Competitor B: 420 reviews, 4.5 stars, active Q&A, professional photos, video tours
Competitor C: 340 reviews, 4.6 stars, strong citation profile, local link building
Zero Tracking: No visibility into how many calls, direction requests, website clicks, or appointments came from Google Business Profiles. No ranking tracking. No review monitoring. Marketing ROI from local search was completely invisible.
Our Approach & Strategy
Phase 1: GBP Audit, NAP Cleanup & Foundation Optimization (Week 1)
Google Business Profile Complete Optimization (All 5 Locations):
Element
Before
After (Optimized)
Business Name
Inconsistent (some had “Dr. Kumar’s SparkSmile”, others just “SparkSmile”)
Standardized: “SparkSmile Dental Clinic – [Area Name]” across all
750-word keyword-rich description unique to each location — mentioning area landmarks, neighborhoods served, specialties, insurance accepted, languages spoken
Hours
Wrong on 4 locations
Verified and corrected, including special hours for holidays and emergency availability
TRIGGER: Patient appointment completed (marked in clinic system)
STEP 1 (2 hours post-appointment): → SMS via Podium: "Hi [Name], thank you for visiting SparkSmile [Location]! We'd love your feedback. It takes just 30 seconds → [Google Review Link]" → Direct link opens Google Review form (pre-selected with SparkSmile's specific location)
STEP 2 (If no review after 48 hours): → Follow-up SMS: "Hi [Name], just a gentle reminder — your review helps other patients find quality dental care. Would you mind sharing your experience? → [Link]"
STEP 3 (If no review after 7 days): → Email follow-up with different angle: "Your opinion matters to us — and to other patients looking for a trustworthy dentist in [Area Name] → [Link]"
STEP 4 (After review posted): → If 4-5 stars: Thank you SMS + response posted on Google within 24 hours (see review response below) → If 1-3 stars: ALERT to clinic manager via Slack → personal phone call within 4 hours to resolve → Professional, empathetic response posted on Google ━━━━━━━━━━━━━━━━━━━━━━━━━━━━━━━━━━━━━━━━━━━━━
Review Response Strategy (Every Review Gets a Response):
Rating
Response Approach
Response Time
Example
⭐⭐⭐⭐⭐
Grateful, personal, mention specific treatment if appropriate, invite to return
Within 24 hours
“Thank you so much, Priya! We’re thrilled your teeth whitening experience at our Anna Nagar clinic exceeded expectations. Dr. Meera will be delighted to hear this. We look forward to seeing you at your next check-up! 😊”
⭐⭐⭐⭐
Thank, acknowledge, ask what could make it 5 stars
Within 24 hours
“Thanks for the kind words, Rajesh! We’re glad you had a positive experience. We’d love to know what would make your next visit a perfect 5-star experience — feel free to let us know! 🦷”
“Thank you for sharing your feedback. We take every comment seriously and would love to understand how we can improve. Could you reach us at [phone] so we can make things right?”
⭐⭐ or ⭐
Empathetic, apologize, take offline immediately, show action
Within 4 hours
“We’re truly sorry about your experience, [Name]. This doesn’t reflect the standard of care we strive for. Our clinic manager [Name] will call you personally today to understand what happened and resolve this. Your satisfaction matters deeply to us.”
AI-Generated Review Responses (ChatGPT):
For efficiency with volume, ChatGPT generates personalized response drafts based on review content
Clinic manager reviews and approves before posting
Each response is unique — no copy-paste templates (Google detects and devalues repeated responses)
Review Growth Targets:
Location
Reviews Before
Monthly Target
6-Month Goal
Anna Nagar
32 reviews, 3.9★
25 new/month
180+ reviews, 4.7★
T. Nagar
28 reviews, 3.7★
25 new/month
175+ reviews, 4.7★
Velachery
22 reviews, 4.0★
20 new/month
140+ reviews, 4.8★
OMR
24 reviews, 3.8★
25 new/month
170+ reviews, 4.7★
Tambaram
18 reviews, 3.6★
20 new/month
135+ reviews, 4.7★
Total
124 reviews, 3.8★ avg
115 new/month
800+ reviews, 4.7★ avg
Phase 3: Local Content Strategy & Location Pages (Week 3)
Profile views, search queries, phone calls, direction requests, website clicks, booking clicks — per location with trend
Rankings
Google Maps position for all target keywords × 5 locations — weekly movement tracking
Reviews
New reviews/month, average rating, response rate, rating trend — per location
Local Traffic
Organic traffic to location pages, service-location pages, local blog posts
Conversions
Appointment bookings from Google, phone calls tracked, WhatsApp inquiries — per location
Citations
Citation count, consistency score, new citations built — per location
Competitor Comparison
Rating, review count, posting frequency, and ranking comparison vs. top 3 competitors
Revenue Attribution
New patient inquiries from local search × average patient value = estimated revenue
Monthly Local SEO Report (AI-Generated):
SPARKSMILE LOCAL SEO — MARCH 2025
━━━━━━━━━━━━━━━━━━━━━━━━━━━━━━━━

📊 OVERALL: Strong Progress (Score: 78/100, ↑12 vs Feb)

🗺️ RANKINGS:
  Keywords in Local 3-Pack: 26 of 30 (87%) — ↑8 vs Feb
  Top keyword: "dentist anna nagar" → Position #1 🏆
  Biggest mover: "dental implants omr" → #14 to #2

⭐ REVIEWS:
  New reviews this month: 128 (target: 115) ✅
  Average rating: 4.72★ (↑ from 4.58★)
  Total reviews across locations: 486 (↑ from 358)
  Response rate: 100%

📞 PATIENT INQUIRIES FROM GOOGLE:
  Phone calls from GBP: 248 (↑34% vs Feb)
  Direction requests: 186 (↑28% vs Feb)
  Website clicks from GBP: 412 (↑42% vs Feb)
  Appointment bookings from local search: 142 (↑52% vs Feb)
  Total local search inquiries: 340+

💰 ESTIMATED REVENUE IMPACT:
  New patients from local search: 142
  Estimated first-visit value: $85 avg
  Estimated annual value per patient: $420
  Projected annual revenue from local search patients:
  142 × $420 = $59,640/month potential LTV

🎯 NEXT MONTH PRIORITIES:
  1. Push "dental implants chennai" into top 3 (currently #4)
  2. Velachery location needs more review focus (lowest count)
  3. Launch "Free Dental Check-Up Camp" event posts across all locations
  4. Build 8 new local backlinks from Chennai health publications
━━━━━━━━━━━━━━━━━━━━━━━━━━━━━━━━━━━━━━━━━━━━━━━━
Key Features Delivered
Feature
Description
5 Fully Optimized Google Business Profiles
Complete optimization — categories, descriptions, services, photos (40+ per location), videos, Q&A, attributes, and appointment links
NAP Consistency Across 85 Directories
Audited and corrected 47 inconsistencies + built 38 new citations ensuring 100% NAP accuracy
Automated Review Generation System
SMS + email review request sequences via Podium generating 115+ new reviews monthly with 100% response rate
Estimated Monthly Patient Revenue (from Local Search)
$18,480
$59,640
⬆ 223%
Review Response Rate
12% (sporadic)
100% (within 24 hours)
⬆ 733%
Google Posts Published/Month
0
125-150 (across 5 locations)
—
📋 Case Study Summary
Challenge: SparkSmile Dental Group’s 5 Chennai clinics were invisible in local search — zero presence in Google’s Local 3-Pack, only 124 reviews at 3.8 stars, NAP inconsistencies across 47 directories, no location-specific web pages, no GBP content strategy, and just 44 appointment bookings monthly from Google. Competitors with 680+ reviews and optimized profiles were capturing all the local search patients.
Solution: We executed a comprehensive local SEO strategy — fully optimizing all 5 Google Business Profiles, cleaning NAP across 85 directories, building an automated review generation system (115+ new reviews/month), creating 35 location-specific web pages with local schema markup, publishing 125+ GBP posts monthly, building 40+ local backlinks, and implementing geo-grid ranking tracking with performance dashboards.
Result: 87% of target keywords now in Google’s Local 3-Pack (from zero). Reviews grew from 124 to 810+ at 4.72 stars. Appointment bookings from Google increased 223% (44 to 142/month). Total local search inquiries tripled to 340+/month. Estimated monthly patient revenue from local search: $59,640 — a 223% increase.
Invisible on Google Maps? Your Competitors Are Getting Your Customers.
We optimize your Google Business Profile, build local authority, generate reviews at scale, and dominate local search results — so when nearby customers search for what you offer, they find you first, trust you most, and choose you every time.