We designed and launched a complete social media advertising system for NestCraft Living — building a full-funnel paid social engine across Meta, Pinterest, and YouTube that generated ₹1.84Cr in attributed revenue over 6 months at a blended 6.8x ROAS, reducing cost-per-acquisition by 62% and transforming paid social from their weakest channel into their primary revenue driver.
Meta Business Suite, Meta Ads Manager, Pinterest Ads Manager, Google Ads (YouTube), Meta Pixel, Pinterest Tag, Google Tag Manager, Google Analytics 4, Shopify (storefront + product catalog), Triple Whale (attribution), Canva Pro, CapCut Pro, ChatGPT API (OpenAI), Midjourney (lifestyle ad imagery), Notion, Google Sheets, Looker Studio, Zapier, Slack, Hotjar (landing page heatmaps)
Project Year
2025
The Overview
NestCraft Living is a D2C home furniture and decor brand based in Pune, offering a curated range of 240+ products — from solid sheesham wood dining tables and handwoven jute rugs to modular bookshelves, artisan ceramic planters, and handcrafted brass lighting. Every piece is designed in-house, sustainably sourced, and manufactured by Indian artisan clusters. Their price point sits in the premium-accessible range — a 6-seater dining table at ₹38,000, a handwoven rug at ₹5,500, a statement bookshelf at ₹22,000.
Their Shopify store was beautifully designed. Product photography was excellent — lifestyle room settings, close-up material shots, 360-degree views. Customer reviews averaged 4.5 stars across 1,800+ reviews. Organic traffic was healthy, and their email list of 28,000 subscribers drove consistent repeat purchases.
But paid social media advertising — the channel that should have been their growth engine — was hemorrhaging money.
NestCraft had been running Facebook and Instagram ads in-house for 14 months. They’d spent ₹42 lakh total. Their blended ROAS (Return on Ad Spend) was 1.6x — meaning for every ₹1 spent on ads, they made ₹1.60 in revenue. After product costs, shipping, returns, and overheads, they were losing money on every ad-acquired customer. Their cost-per-acquisition was ₹2,800 — on products with an average order value of ₹4,500 and a gross margin of 45%. The math didn’t work.
The problem wasn’t that paid social doesn’t work for furniture. Competitors like Wakefit, Urban Ladder, and Wooden Street were scaling aggressively through Meta and YouTube ads. The problem was how NestCraft was doing it — boosted posts instead of proper campaigns, no funnel structure, no retargeting, no dynamic product ads, zero presence on Pinterest (the highest-intent home decor platform), no YouTube ads despite having beautiful video content, and creative fatigue from running the same 5 ad sets for months.
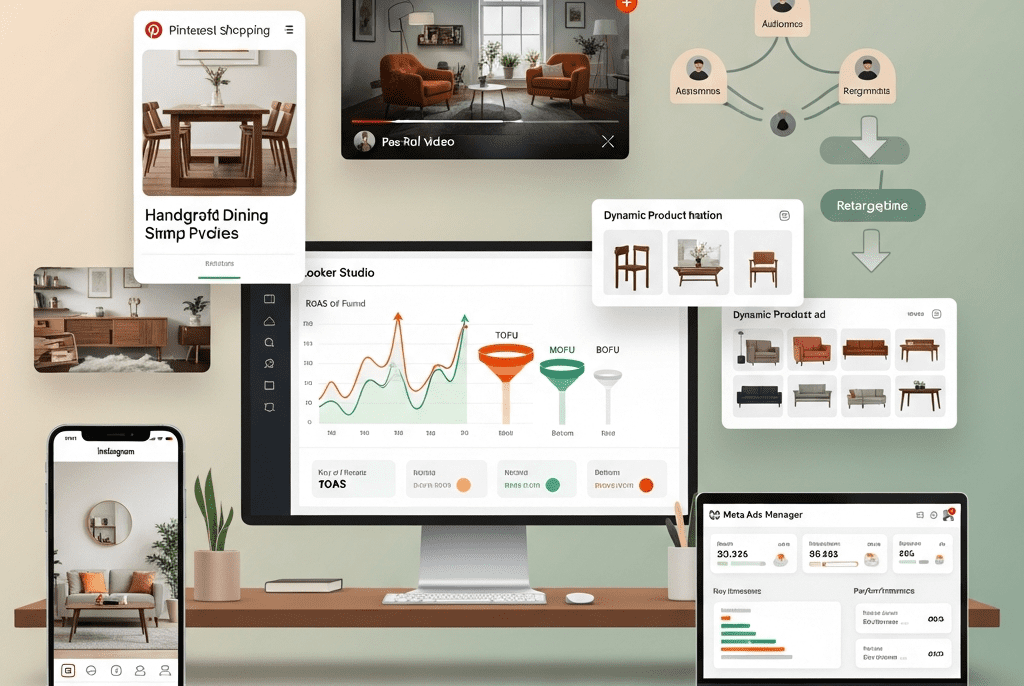
We built a complete social media advertising system — from full-funnel campaign architecture and audience segmentation to creative strategy, dynamic product ads, multi-platform retargeting, budget allocation frameworks, and a performance optimization playbook — transforming NestCraft’s paid social from a money pit into a predictable, scalable revenue machine.
The Challenge
Abysmal Ad Performance Despite Significant Spend:
Metric
NestCraft (Before)
Industry Benchmark (Home Decor D2C)
Gap
Blended ROAS
1.6x
4.0x–6.0x
60–73% below benchmark
Cost Per Acquisition (CPA)
₹2,800
₹800–₹1,200
133–250% above benchmark
Click-Through Rate (CTR)
0.6%
1.2%–2.0%
50–70% below benchmark
Cost Per Click (CPC)
₹18.40
₹6–₹10
84–207% above benchmark
Conversion Rate (Ad → Purchase)
0.8%
2.0%–3.5%
60–77% below benchmark
Ad Frequency (Avg)
8.4
<3.0
180% above (massive creative fatigue)
Total Spend (14 months)
₹42,00,000
—
—
Total Revenue from Ads
₹67,20,000
—
—
Net Profit from Ads
Negative (after COGS, shipping, returns)
—
Losing money on every acquisition
“Boost Post” Mentality — No Proper Campaign Structure: NestCraft’s “advertising strategy” was literally pressing the blue “Boost Post” button on their best-performing organic Instagram posts. No campaign objectives beyond “engagement,” no ad sets with proper targeting, no conversion optimization, no funnel stages. They were paying for likes, not for purchases. Facebook’s algorithm was optimizing for the cheapest engagement (people who like posts but never buy), not for high-intent purchasers.
Zero Funnel Architecture: Every ad sent cold traffic directly to the homepage with a “Shop Now” CTA. No awareness campaigns building brand familiarity. No consideration campaigns educating about craftsmanship and quality. No retargeting campaigns recapturing the 97% of visitors who left without buying. A person seeing NestCraft for the first time was shown the exact same ad as someone who’d visited the site 5 times and abandoned cart with ₹35,000 worth of furniture. No segmentation. No journey.
Single Platform Dependency: 100% of ad spend went to Meta (Facebook + Instagram). Zero presence on Pinterest — where 85% of users actively plan home decor purchases and purchase intent is 2.5x higher than any other social platform. Zero YouTube ads — despite having beautiful product and room-tour videos. Two massive, high-intent platforms completely untouched.
Creative Fatigue & Poor Ad Quality:
Problem
Details
5 ad creatives running for 8+ months
Same product photos recycled since launch — audience had seen each ad 8.4 times on average
No video ads
100% static images — in a category where video (room walkthroughs, material close-ups, assembly timelapses) dramatically outperforms static
No lifestyle imagery
Products photographed on white backgrounds — no room context, no aspiration, no “imagine this in your home”
Generic copy
“Shop premium furniture at NestCraft” — no storytelling, no craftsmanship narrative, no urgency, no social proof, no objection handling
Wrong formats
Single-image ads only — no carousels showcasing product range, no collection ads for room categories, no dynamic product ads showing items people actually browsed
No Conversion Tracking Infrastructure: Meta Pixel was installed but misconfigured — tracking page views but not “Add to Cart,” “Initiate Checkout,” or “Purchase” events. Without proper conversion data, Facebook’s algorithm couldn’t optimize for buyers. It was flying blind — finding people who click, not people who buy. No server-side tracking, no Conversions API, no UTM parameters, no attribution model beyond last-click.
Boosted posts, single images, no funnel, no retargeting, no video, no Pinterest/YouTube
No Budget Allocation Framework: The monthly ₹3L budget was spent arbitrarily — sometimes ₹2L in one week on a “performing” ad (that was performing by vanity metrics — likes, not sales), sometimes paused entirely when the founder felt “ads aren’t working.” No daily budget discipline, no campaign-level allocation, no scaling rules, no kill criteria for underperformers.
Limited-time offers, free shipping thresholds, festive sale
BOFU
Social Proof
Static + Video, 1:1 + 9:16
5 creatives
Customer review quotes overlaid on product images, star ratings, “2,400+ happy homes”
BOFU
“Still Thinking?” Retargeting
Static + Video (15 sec), 1:1
4 creatives
Shows exact product they viewed + incentive (“Free delivery on your first order”)
Post-Purchase
Cross-Sell
Carousel (4 slides), 1:1
4 carousels
“Complete Your [Room]” — complementary products based on purchase category
Post-Purchase
New Arrivals
Carousel + Video, 1:1 + 9:16
3 sets/month
Seasonal new product launches
Total Initial Creative Production: 72 ad creatives across all formats and funnel stages
Ad Creative Production System (Ongoing):
MONTHLY AD CREATIVE PRODUCTION CYCLE
━━━━━━━━━━━━━━━━━━━━━━━━━━━━━━━━━━━━━

WEEK 1 — ANALYSIS & PLANNING:
  → Review past month ad performance by creative
  → Identify: Top 5 performers (scale), Bottom 5 (kill), Fatigued (frequency > 4)
  → Analyze competitor ads (Meta Ad Library, Pinterest Trends)
  → Plan new creative concepts for each funnel stage
  → Create creative brief document

WEEK 2 — PRODUCTION:
  → Shoot new product/lifestyle photos (if needed)
  → Design static ads in Canva Pro (6–8 new)
  → Edit video ads in CapCut Pro (4–6 new)
  → Write ad copy variations (3 copy versions per creative)
  → Generate AI lifestyle imagery via Midjourney (room settings)
  → Create Pinterest-specific pin designs

WEEK 3 — TESTING:
  → Launch new creatives as A/B tests against current winners
  → Test: Creative (image/video) × Copy × Audience combinations
  → Budget: ₹500–₹1,000/day per test ad set (3-day test window)
  → Decision criteria: CTR, CPC, ATC rate (not ROAS — too early)

WEEK 4 — OPTIMIZATION:
  → Promote test winners to main campaigns
  → Kill underperformers (below threshold after 3 days + ₹2,000 spend)
  → Refresh ad copy on fatigued high-performers (new copy, same creative)
  → Update DPA catalog templates seasonally

MONTHLY OUTPUT: 15–20 new ad creatives
CREATIVE LIBRARY GROWTH: Cumulative testing builds a library of
  proven winners — by Month 6, 80+ tested creatives with clear
  performance data on each
━━━━━━━━━━━━━━━━━━━━━━━━━━━━━━━━━━━━━━━━━━━━━━━━━━━━━━━━
“Your home tells a story. Make it one worth telling. → NestCraft brings India’s finest artisan woodcraft to your living room — handcrafted from solid sheesham by 3rd-generation carpenters in Jodhpur. → Explore the collection ↗”
MOFU
Educational, value-driven, comparative
Hook → Product benefit/differentiation → Social proof → CTA (Shop/Browse)
“Not all ‘solid wood’ furniture is actually solid wood. Here’s how to tell. → Swipe through our guide to spotting quality craftsmanship → 4.5★ across 1,800+ reviews → Shop genuine solid wood →”
“Your Jodhpur Dining Table is on its way! 🎉 → Complete the look with matching chairs — 15% off your second order → Shop Dining Chairs →”
Dynamic Product Ads (DPA) Setup:
DPA Element
Configuration
Product Catalog
Shopify → Meta Commerce Manager sync — all 240+ products with: title, description, price, sale price, image URL, product URL, availability, category, material, room type
Catalog Segmentation
Product sets by: Room (Living Room, Bedroom, Dining, Study, Outdoor), Category (Tables, Seating, Storage, Lighting, Decor, Rugs), Price Range (<₹5K, ₹5K–₹15K, ₹15K–₹40K, ₹40K+), New Arrivals, Best Sellers, On Sale
DPA Template Design
Custom Canva-designed catalog ad frames: product image in center, NestCraft logo top-left, price tag bottom-right, “Free Delivery” badge (for qualifying products), material icon (wood/brass/jute)
DPA Retargeting Rules
Viewed product but didn’t ATC (show viewed product + 3 similar), ATC but didn’t purchase (show carted product with urgency), Purchased (show complementary products from same room category)
Pinterest Catalog
Shopify → Pinterest catalog sync, product pins auto-generated, shopping ads enabled across all product sets
DPA Performance Monitoring
Per-product ROAS tracked — products with ROAS < 3x after ₹2,000 spend are paused, top performers get increased bid
CHECK 1 — Spend Pacing: → Is daily spend tracking to monthly budget? (±10% variance OK) → Any campaign overspending? → Adjust daily budget → Any campaign underspending? → Check ad review status, audience saturation
CHECK 2 — BOFU ROAS: → ROAS > 5x → Scale: increase budget 20% (max every 3 days) → ROAS 3x–5x → Maintain: keep budget, monitor → ROAS 2x–3x → Optimize: test new creatives, check frequency → ROAS < 2x for 3+ days → Investigate: audience fatigue? creative fatigue? landing page issue? → ROAS < 1.5x for 5+ days → Kill: pause ad set, reallocate budget
CHECK 3 — Frequency: → TOFU frequency > 2.0 → Expand audience or refresh creative → MOFU frequency > 3.0 → Refresh creative, rotate messaging → BOFU frequency > 4.0 → Urgent: creative fatigue, performance will tank → All platforms: frequency < 1.0 → Budget may be too low or audience too broad
CHECK 5 — Creative Performance: → Any ad with CTR < 0.8% after ₹2,000 spend → Kill → Any ad with CPA > 2x target after ₹3,000 spend → Kill → Any ad delivering < 100 impressions/day → Check: ad rejected? audience too narrow? ━━━━━━━━━━━━━━━━━━━━━━━━━━━━━━━━━━━━━━━━━━━━━━━━━━━━━━━━
→ Review all campaigns: ROAS, CPA, CTR, Spend, Frequency → Pause underperforming ad sets (below threshold for 5+ days) → Scale winning ad sets (increase budget 20% — never more than 20% per adjustment) → Refresh ad copy on high-frequency winners → Review audience overlap (Audience Overlap tool — merge or exclude overlapping audiences) → Check auction insights: any new competitor bidding aggressively? → Update performance dashboard
→ Full funnel analysis: Is TOFU feeding MOFU? Is MOFU feeding BOFU? → Budget reallocation across funnel stages based on performance → Platform budget reallocation (Meta vs. Pinterest vs. YouTube) → Creative audit: which visual styles, video types, copy angles perform best? → Audience audit: which audiences have highest ROAS? Expand or create new LALs → Landing page analysis: conversion rate by landing page, heatmap review (Hotjar) → Competitive analysis: check Meta Ad Library for competitor creative changes → Plan next month's creative production and testing roadmap ━━━━━━━━━━━━━━━━━━━━━━━━━━━━━━━━━━━━━━━━━━━━━━━━━━━━━━━━━━━━━
Scaling Framework:
Scaling Method
When to Use
How
Risk Level
Vertical Scaling
Ad set with ROAS > 5x and frequency < 3
Increase budget 20% every 3 days (never jump more than 20% — Meta algorithm resets learning phase)
Low
Horizontal Scaling — Audience
Winning creative wants more reach
Duplicate winning ad into new audience (different LAL seed, new interest stack, different LAL %)
Medium
Horizontal Scaling — Platform
Winning creative/concept on one platform
Adapt winning Meta creative for Pinterest/YouTube
Medium
Horizontal Scaling — Placement
Winning in Feed, untested in Reels/Stories
Create placement-optimized versions of winning creative
Upcoming tests planned for next 3 months — what to test, why, expected impact
Notion roadmap
Seasonal Campaign Templates
Pre-built campaign structures, audience configurations, and creative briefs for each seasonal event
Notion + Canva templates
Reporting Template
Looker Studio dashboard + weekly/monthly report template
Looker Studio + Google Slides
Vendor & Tool Access
All platform logins, tool subscriptions, API keys, and third-party access documentation
Encrypted document
SOP — Crisis Playbook
What to do when: ad account gets flagged/disabled, ROAS drops below 2x suddenly, budget accidentally overspends, creative gets rejected
Notion SOP
Key Features Delivered
Feature
Description
Complete Conversion Tracking Infrastructure
Meta Pixel (8 events), Conversions API, Pinterest Tag, Google Tag Manager, GA4 Enhanced E-Commerce, Triple Whale attribution, UTM framework, and offline conversion tracking — capturing 30–40% more data than browser-only tracking
TOFU (Awareness) → MOFU (Consideration) → BOFU (Conversion/Retargeting) → Post-Purchase (Retention) — with distinct objectives, audiences, creatives, and KPIs per stage
3-Platform Paid Social Engine
Meta (60%), Pinterest (25%), YouTube (15%) — each with platform-native campaign structures, creative formats, and optimization strategies
72 Initial Ad Creatives
Videos, carousels, static images, dynamic product ads, Pinterest Idea Pins, and YouTube pre-rolls — organized by funnel stage, with 3 copy variations each
Dynamic Product Ads (DPA)
240+ product catalog synced from Shopify to Meta and Pinterest, segmented by room, category, and price range, with custom-designed catalog frames and automated retargeting rules
Monthly Creative Production System
4-week cycle: Analysis → Production (15–20 new creatives) → Testing → Optimization — building a growing library of proven performers
Structured A/B Testing Framework
8 test types (creative, copy, audience, format, landing page, placement, bid strategy, offer) with clear methodology, duration, budget, and decision criteria — producing 2–3 new proven winners monthly
Campaign Optimization Playbook
Daily (15-min checks), weekly (1-hour review), and monthly (3-hour audit) optimization procedures with specific decision rules for scaling, pausing, and troubleshooting
Cross-Platform Retargeting Orchestration
Coordinated retargeting across Meta, Pinterest, and YouTube — sequenced by user behavior (viewed → ATC → checkout → purchased) with platform-specific frequency caps
Ad-Specific Landing Page Strategy
7 landing page types matched to ad campaign intent — with conversion element optimization and Hotjar-based behavioral analysis
Performance Reporting Dashboard
12-section Looker Studio dashboard covering executive summary, platform breakdown, funnel analysis, creative/audience/product performance, attribution, budget tracking, and competitive insights
Seasonal Campaign Calendar & Templates
8 seasonal campaigns with pre-built structures, audience configurations, budget adjustments, and creative briefs — ready to activate each season
Scaling Framework
7 scaling methods (vertical, horizontal by audience/platform/placement/creative, offer scaling, geographic expansion) with specific triggers and risk levels
₹52,40,000 gross profit (after COGS, shipping, ad spend)
—
Ad Creatives Tested (Cumulative)
5 (never changed)
180+ (systematic testing)
—
Proven Winner Creatives in Library
0 (no testing)
42 (with performance data)
—
📋 Case Study Summary
Challenge: NestCraft Living — a D2C furniture and home decor brand with 240+ products and 4.5-star reviews — had spent ₹42L on paid social over 14 months with a 1.6x ROAS, losing money on every ad-acquired customer. Their “strategy” was boosting Instagram posts with no funnel structure, no retargeting, no dynamic product ads, no Pinterest or YouTube presence, 5 stale ad creatives running for 8 months, misconfigured conversion tracking, and no budget allocation framework. Competitors like Wakefit and Urban Ladder were scaling at 5–7x ROAS while NestCraft bled money.
Solution: We built a complete social media advertising system — overhauling conversion tracking (Meta Pixel, CAPI, Pinterest Tag, GTM, GA4, Triple Whale); creating an 18-audience architecture with custom, lookalike, interest, and platform-specific audiences; designing a 4-stage full-funnel campaign system (Awareness → Consideration → Conversion → Retention) across Meta (60%), Pinterest (25%), and YouTube (15%); producing 72 initial ad creatives including video, carousels, and dynamic product ads; implementing a monthly creative production and A/B testing system; building a campaign optimization playbook with daily/weekly/monthly procedures; orchestrating cross-platform retargeting with frequency caps; optimizing landing pages with Hotjar behavioral analysis; and creating a 12-section performance dashboard with seasonal campaign calendar and complete handover documentation.
Result: In 6 months, blended ROAS jumped from 1.6x to 6.8x. CPA dropped 76% (₹2,800 → ₹680). Overall CPA across all channels fell 62%. Monthly ad-attributed revenue grew 608% (₹4.8L → ₹34L). Total 6-month ad-attributed revenue reached ₹1.84Cr. Meta ROAS hit 7.2x, Pinterest contributed ₹7.25L/month at 5.8x ROAS, and YouTube added ₹3.15L/month. BOFU retargeting alone achieved 12.4x ROAS. Video ad CTR was 417% higher than previous static ads. The ad channel went from losing money to generating ₹52.4L gross profit. NestCraft’s paid social transformed from their weakest channel into their primary scalable revenue driver.
Tired of Burning Money on Ads That Don’t Convert?
We build social media advertising systems that turn your ad spend into a predictable, scalable revenue engine — with full-funnel architecture, multi-platform campaigns, dynamic product ads, conversion tracking, and optimization playbooks that make every CENT work harder.